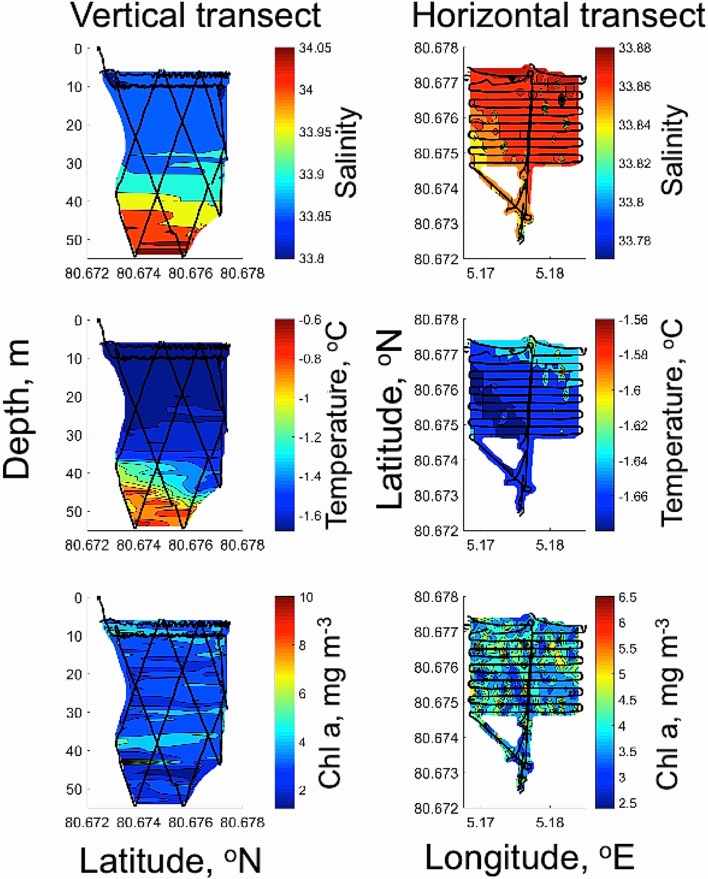
Fig. 5.
AUV-based vertical (left panels, black lines) and horizontal (right panels, black lines) mapping of phytoplankton biomass ([Chl a], lower panel), temperature (mid panel) and salinity (upper panel) of water masses under sea ice at ice station 3. Spatial coverage of Chl a (mg m−3), salinity (PSU) and temperature (°C) using Remus 100 AUV in vertical zig-zag mode transect covering 16,500 m2 and a horizontal grid area at 10 m depth covering 80,000 m2 (400 × 200 m)

