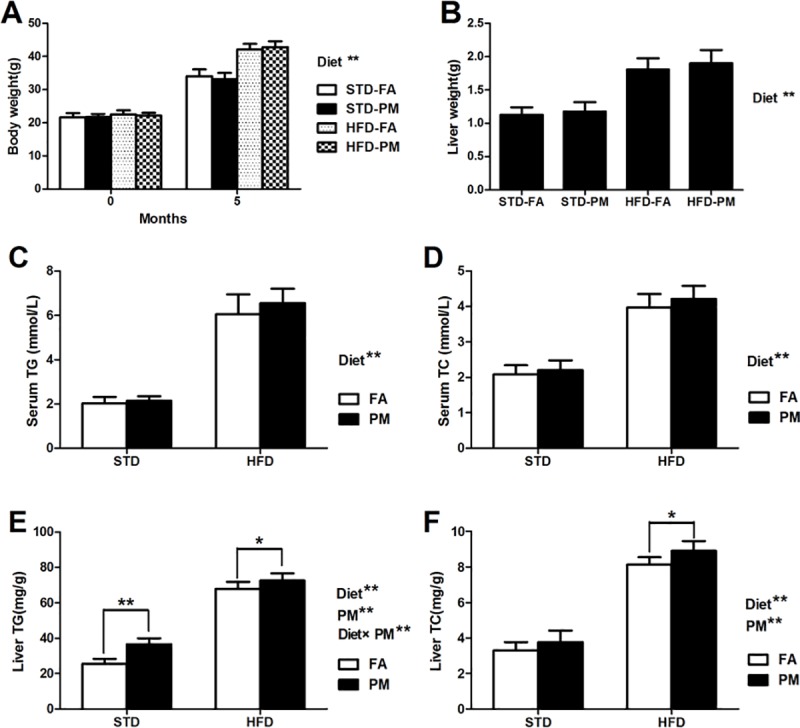
Fig 2. The body weight, liver weight, serum and hepatic lipid levels (n = 10).

(A) Body weight. (B) Liver weight. (C) Serum TG levels. (D) Serum TC levels. (E) TG levels in liver. (F) TC levels in liver. Data are expressed as the mean ± SD. *, P<0.05 and **, P<0.01 compared with the STD-FA group. ##, P<0.01 compared with the STD-PM group. Diet** indicates the HFD. PM** indicates PM exposure. *, P<0.05 and **, P<0.01. Diet×PM indicates the interaction effect between HFD and PM exposure.
