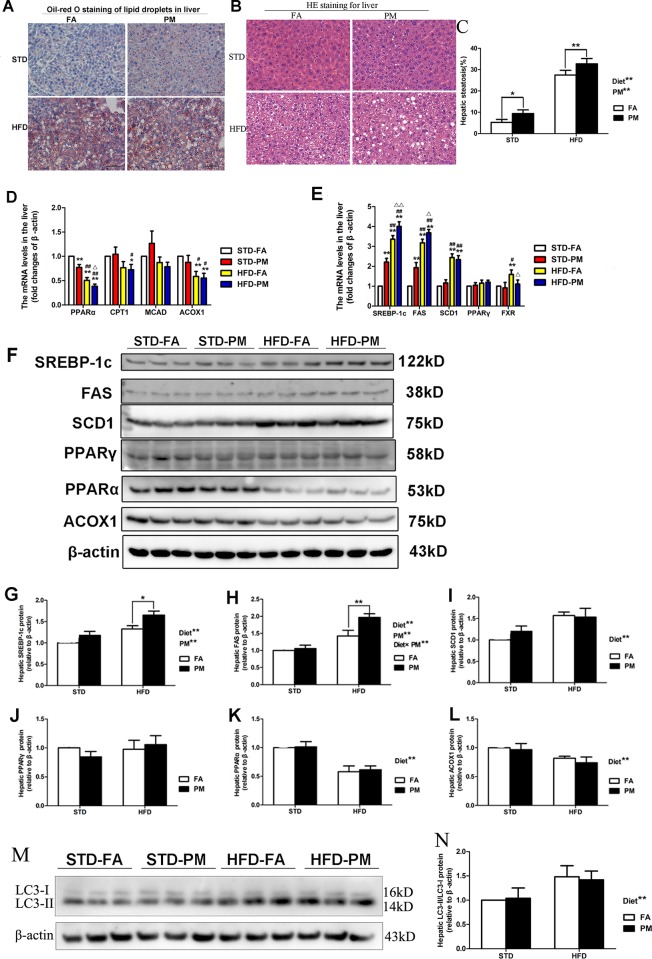
Fig 3. Ambient PM exposure leads to hepatic steatosis by impairing hepatic lipid metabolism.
(A) Oil Red O staining observation of liver (×200, scale bars = 100 μm). (B) H&E staining observation of liver (×200, scale bars = 50 μm). (C) The volume density of quantitation of hepatic steatosis (n = 5). (D) The genes expression involved in fatty acid β-oxidation in liver (n = 5). (E) The mRNA expression of genes involved in lipogenesis and FXR in liver (n = 5). (F) Bands of PPARα, PPARγ, ACOX1, FAS, SREBP-1c, SCD1. (G) Protein expression of SREBP-1c (n = 3). (H) Protein expression of FAS (n = 3). (I) Protein expression of SCD1 (n = 3). (J) Protein expression of PPARγ (n = 3). (K) Protein expression of PPARα (n = 3). (L) Protein expression of ACOX1 (n = 3). (M) Bands of LC3-I and LC3-II. (N) The ratio of LC3-II and LC3-I (n = 3). Data are expressed as the mean ± SD. *, P<0.05 and **, P<0.01 compared with the STD-FA group. #, P<0.05 and ##, P<0.01 compared with the STD-PM group. Δ, P<0.05 and ΔΔ, P<0.01 compared with the STD-PM group. Diet** indicates the HFD. PM** indicates PM exposure. *, P<0.05 and **, P<0.01. Diet×PM indicates the interaction effect between HFD and PM exposure.

