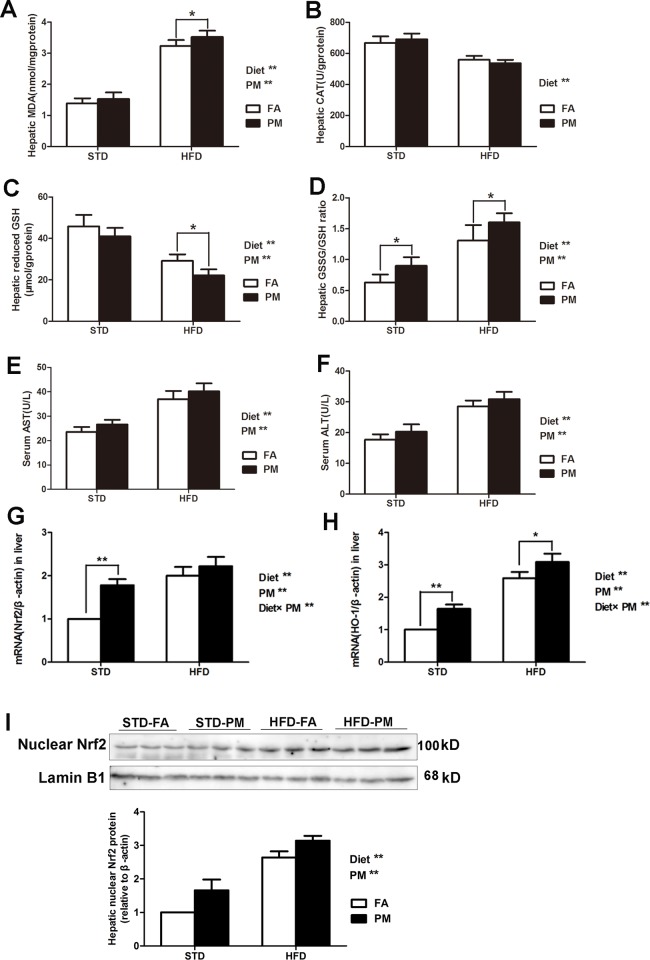
Fig 4. Ambient PM exposure induced liver injury and oxidative response in liver.
(A) Hepatic MDA levels (n = 8–10). (B) Hepatic CAT levels (n = 8–10). (C) Hepatic reduced GSH levels (n = 8–10). (D) Hepatic GSSH/GSH ratio (n = 8–10). (E) Serum AST (n = 10). (F) Serum ALT (n = 10). (G) The mRNA expression of Nrf2 (n = 5). (H)The mRNA expression of HO-1(n = 5). (I) Immunoblotting of hepatic nuclear Nrf2 in four groups. (J) Immunoblotting analysis of hepatic nuclear Nrf2 in four groups (n = 3). Data are expressed as the mean ± SD. *, P<0.05 and **, P<0.01.Diet** indicates the HFD. PM** indicates PM exposure. Diet×PM indicates the interaction effect between HFD and PM exposure.

