
Figure 3:
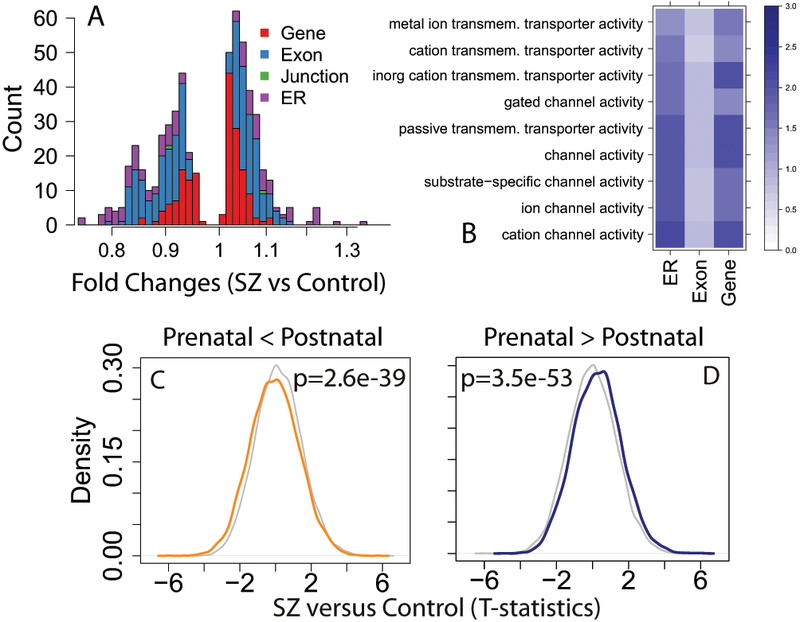
Differential expression comparing patients with schizophrenia to controls. (A) Histogram of fold changes of the diagnosis effect of those features that were significant and independently replicated, colored by feature type. (B) Gene set analyses of genes with decreased expression in patients compared to controls by feature type. Coloring/scaling represents -log10(FDR) for gene set enrichment. Significant directional effects of developmental regulation among diagnosis-associated genes for those that (C) increased and (D) decreased across development. P-values (two-sided) were calculated using linear regression Wald tests for those genes developmentally regulated among case-control differences to those not developmentally regulated across the 24,122 expressed genes.