
Fig. 4|. Enhanced BH4 production results in enhanced T-cell proliferation and anticancer immunity.
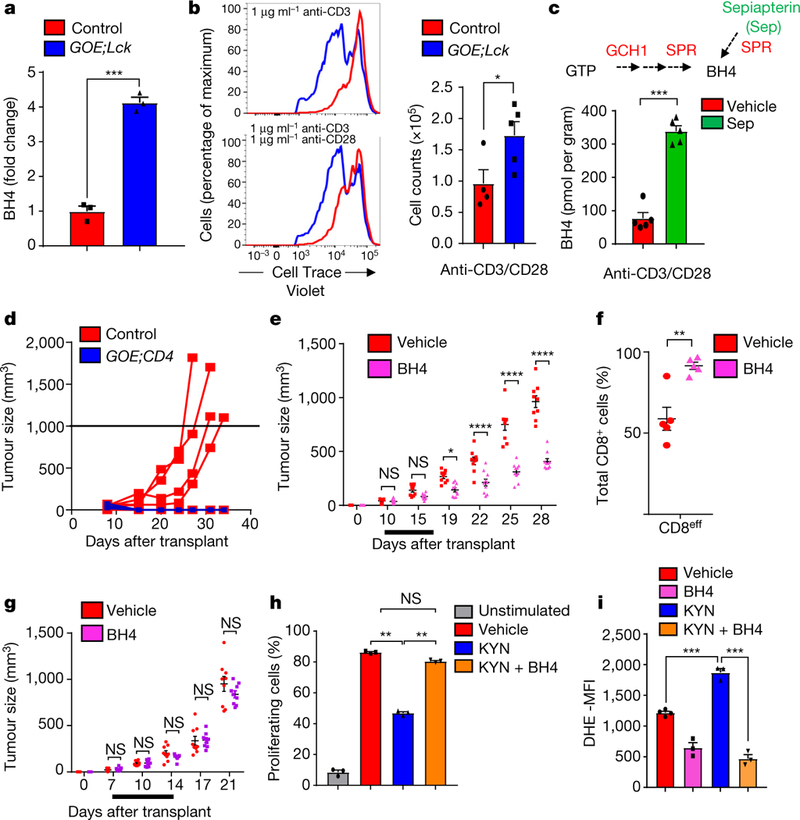
a, Fold change in BH4 levels after 24-hour-stimulation of CD4+ T cells. Data for individual mice (n = 3) are given as means ± s.e.m. b, Representative histograms after three days of CD4+ T cell proliferation, from control (n = 4) and GOE;Lck (n = 5) mice. Data are means ± s.e.m. c, BH4 measurements after 24 hours in activated wild-type CD4+ T cells treated with vehicle or sepiapterin (Sep; 5 μM). Data shown for individual mice (n = 5) are given as means ± s.e.m. d, Breast-cancer model, involving orthotopic injection of E0771 breast- cancer cells into syngeneic control (n = 6) and GOE;Lck (n = 7) mice. e, Effect of BH4 supplementation on cancer growth in the E0771 model. Supplementation with BH4 (n = 10 mice) or vehicle (n = 9 mice) was carried out for seven days as indicated (black line). f, Quantification of intratumoral effector CD8+ T cells (CD44+CD62Llo) assayed from E0071 tumours on day 28 of vehicle treatment (n = 5 mice) or BH4 treatment (n = 5 mice). Data are means ± s.e.m. g, Effect of BH4 supplementation on cancer growth in Rag2−/− female hosts. BH4 and vehicle supplementation (n = 9 mice each) was carried out for seven days as indicated (black line). Data are means ± s.e.m. h, Quantification of proliferation of stimulated CD4+ T cells treated with kynurenine (KYN; 50 μM) or BH4 (10 μM). Data are means ± s.e.m.; n = 3 samples for each condition. Experiment was repeated two independent times with similar results. i, Quantification of the mean fluorescent intensity (MFI) of dihydroethidium (DHE, a superoxide ROS indicator) in stimulated wild-type CD4+ T cells treated with vehicle, KYN (50 μM), BH4 (10 μM) or KYN (50 μM) plus BH4 (10 μM) for 20 hours. Data are means ± s.e.m.; n = 3 samples for each condition. The experiment was repeated two independent times with similar results. NS, not significant; *P < 0.05; **P < 0.01; ***P < 0.001; ****P < 0.0001 (two-tailed Student’s t-test for panels a, b, c, f; two-way ANOVA with Sidak’s comparison for panels d, g; one-way ANOVA with Tukey’s comparison for panels h,1).