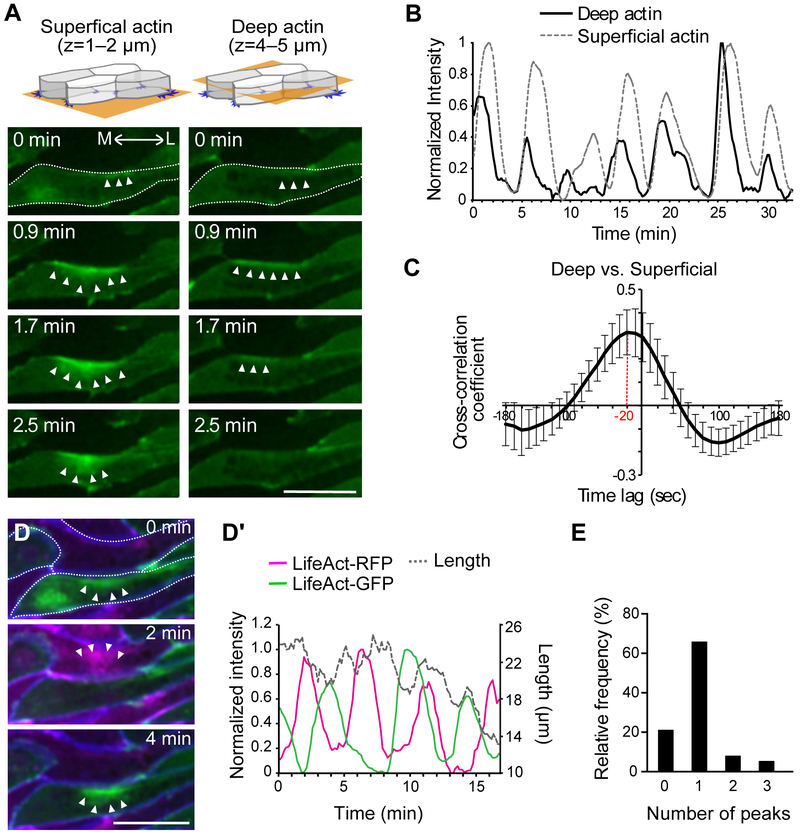
Figure 1. Actomyosin oscillations during convergent extension of the Xenopus dorsal mesoderm.
(A) Mosaic expression of LifeAct-GFP (F-actin marker) allows imaging of labeled cells apposed to unlabeled cells for unambiguous assessment of actin dynamics in the superficial (left) and deep (right) actin populations. Stills from time-lapse movies show the progression of actomyosin flow across time and space (arrowheads). M: medial, L: lateral. Dotted line outlines the cell. (B) Peaks of normalized actin intensity allow quantification of actomyosin dynamics in the deep and superficial populations along contracting v-junctions from a single cell. (C) Actomyosin oscillations in deep and superficial populations are synchronous, showing a significant cross-correlation. (D, D’) Two-color labeling of F-actin in same cells in panel A with membrane-BFP reveals that oscillations along shared v-junctions (See Figure S1A) in apposed cells are out of phase; quantification of normalized intensity together with junction length over time is displayed at right. The cells are outlined with a dotted line. (E) The number of LifeAct’s peaks observed in a given cell between any two peaks occurring in an adjacent cell shows pulses in neighboring cell display a roughly one-to-one ration (See Figure S6). Scale bar = 20 μm

