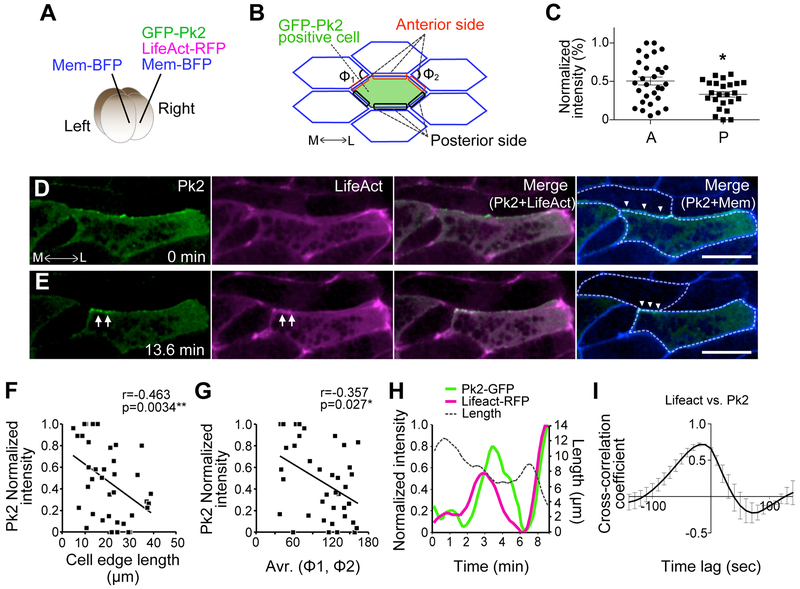
Figure 3. Prickle2 displays temporal and spatial patterns of localization during cell intercalation.
(A) Method for mosaic expression of GFP-Pk2, LifeAct-RFP, and membrane (Mem) -BFP in a Xenopus embryo at 4 cell stage. (B) Scheme showing the cell and cell-cell junctions measured for analysis in C, F, G, and H. The angle of apices of neighboring cells attached to a shrinking junction is indicated as Φ. (C) Mean intensity of GFP-Pk2 on anterior and posterior cell cortices. [* p = 0.0282, Student’s t-test; anterior (A): n = 30, posterior (P): n = 25] (D, E) Still images from time-lapse movie of GFP-Pk2 during junction shrinkage. Images of E are 13.6 minutes after the images in D. Arrowheads indicate contracting v-junction; arrows indicate the accumulation of GFP-Pk2 at the anterior face of the contracting v-junction. (F) Correlation between GFP-Pk2 intensity and the length of cell-cell junctions. GFP-Pk2 intensity is converted to percentages in each image. (38 junctions from 2 embryos). (G) Correlation between GFP-Pk2 intensity and the angle Φ. Same numbers as (F). (H) Quantification of normalized intensity of LifeAct (magenta) and Pk2-GFP (green) together with junction length over time from single contracting cell junction. (I) Synchronous accumulation of F-actin and Pk2 is shown by cross correlation. Scale bar = 20 μm.

