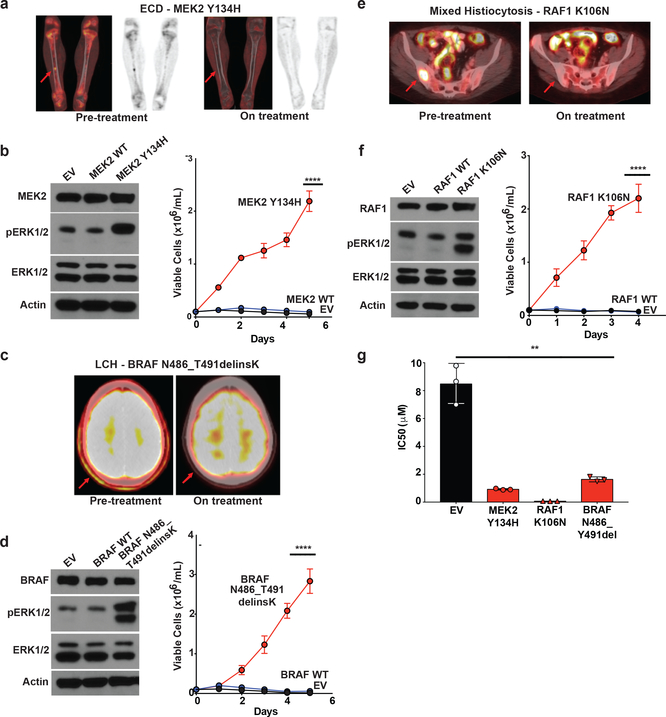
Figure 2: Characterization of novel activating mutations in MEK2, RAF1, and BRAF and their dependence on ERK signaling in histiocytoses.
(a) Coronal PET and fused PET/CT imaging of femurs showing characteristic femoral lesions of ECD from a MEK2 Y134H mutant ECD patient pre- and during cobimetinib treatment. (b) Western blot (left) and number of viable cells (right) following IL-3 withdrawal of Ba/F3 cells stably expressing an empty vector, wild-type (WT) MEK2, or MEK2 Y134H mutant (the average of n=3 biological replicates ± standard deviation (SD) is plotted). Calculation of p-values was performed using two-way ANOVA; ****p<0.0001. (c) Axial fused PET/CT imaging showing skull lesions (arrow) pre- and during cobimetinib treatment in a patient with BRAF N486_T491delinsK mutant LCH. (d) Western blot (left) and number of viable cells (right) following IL-3 withdrawal of Ba/F3 cells stably expressing an empty vector, WT BRAF, or BRAF N486_T491delinsK mutant (the average of n=3 biological replicates ± SD is plotted). Calculation of p-values was performed using two-way ANOVA; ****p<0.0001. (e) Axial fused PET/CT imaging showing sacral lesions (arrow) pre-and during cobimetinib treatment in a patient with mixed histiocytosis and a RAF1 K106N mutation. (f) Western blot (left) and number of viable cells (right) following IL-3 withdrawal of Ba/F3 cells stably expressing an empty vector, WT RAF1, or RAF1 K106N mutant (the average of n=3 biological replicates ± SD is plotted). Calculation of p-values was performed using two-way ANOVA; ****p<0.0001. (g) IC50 of cells from (b), (d), and (e) to 72 hours of cobimetinib. Each experiment was performed with n=3 biological replicates and average ± SD is plotted. The calculation of p-values utilized the Ordinary one-way ANOVA; **p <0.01.

