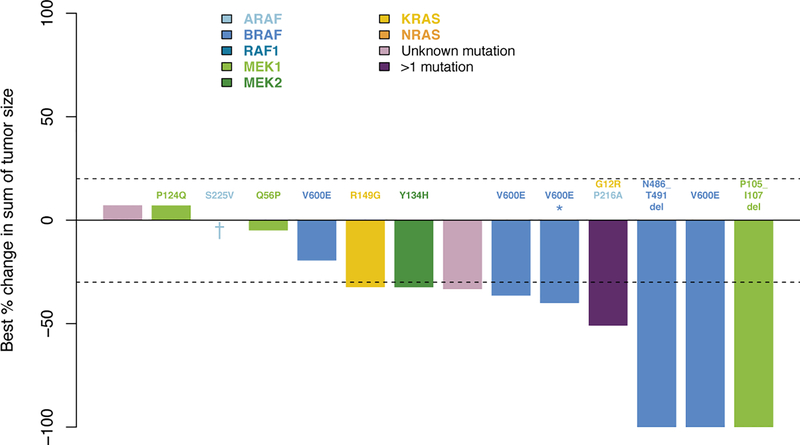
Extended Data Figure 1. Waterfall plot of maximum change in tumor size by RECIST following cobimetinib treatment in histiocytosis patients (n=14).
The upper and lower dotted lines represent cut-offs for progressive disease and partial response, respectively. Colors of bars indicate genomic alteration present. Notations above bars indicate specific mutation. One patient (asterisk) had prior BRAF inhibitor therapy that was discontinued due to intolerance. One patient (dagger) died due to underlying disease.

