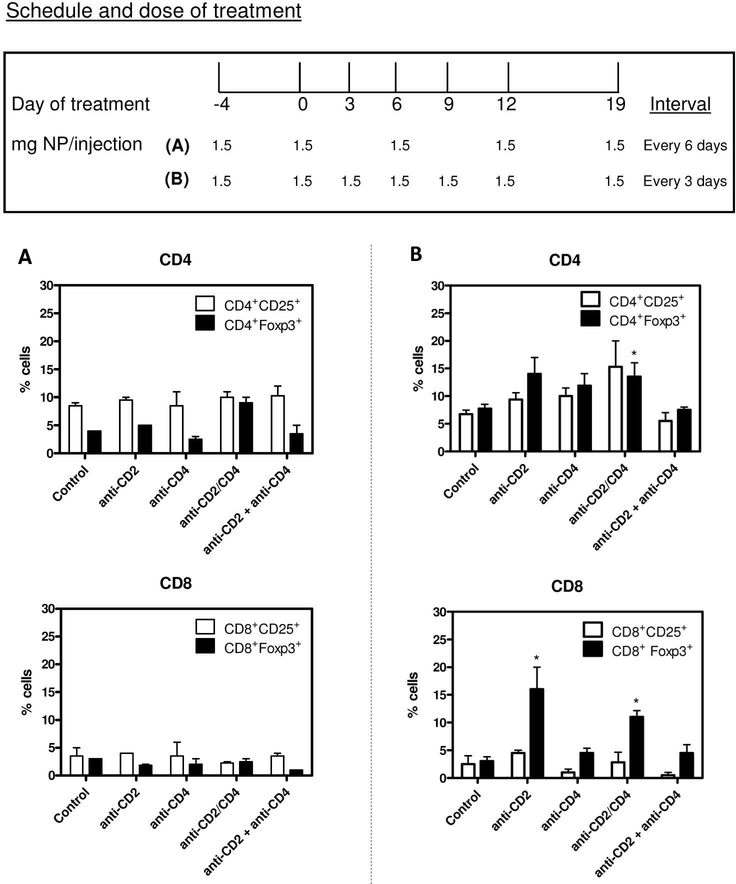
Figure 3. Protocol of PLGA NP administration for the identification of an optimal dose for the expansion of Tregs in vivo.
Comparison of anti-CD2/4 Ab-coated NPs with NPs coated with anti-CD2 and anti-CD4 Ab alone, or in combination. A. Percentages of CD4+ Tregs (top) and CD8+ Tregs (bottom) in mice treated according to protocol (A) indicated in the figure quadrant. B. Percentages of CD4+ Tregs (top) and CD8+ Tregs (bottom) in mice treated according to protocol (B) indicated in the figure quadrant. Representative of two experiments with four mice per group; *P<0.05 by Mann Whitney U test comparisons with control.

