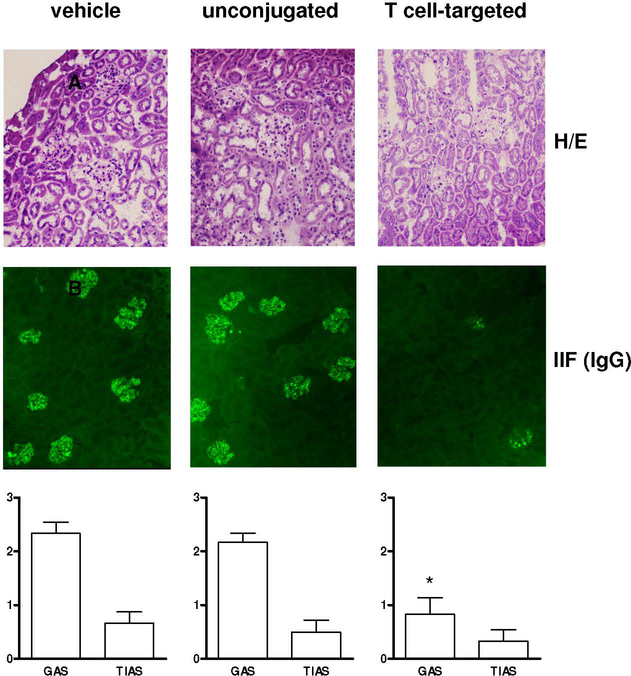
Figure 5. Renal histopathology of BDF1 lupus mice after treatment with NPs encapsulated with IL-2/TGF-β and coated with anti-CD4/CD2 Ab.
Histology of 4-μm kidney sections stained with hematoxylin/eosin (top) and indirect immunofluorescence for IgG (middle). Representative of six mice per group. Magnification: 20x. C. Cumulative glomerular activity score (GAS) and tubulointerstitial activity score (TIAS) in kidneys from mice treated with vehicle, unconjugated of T-cell targeted NPs (n=6 per group) (bottom). Readings were done six weeks after start of treatment. Values are mean ±SD; *P<0.001 vs vehicle group for both GAS and TIAS.

