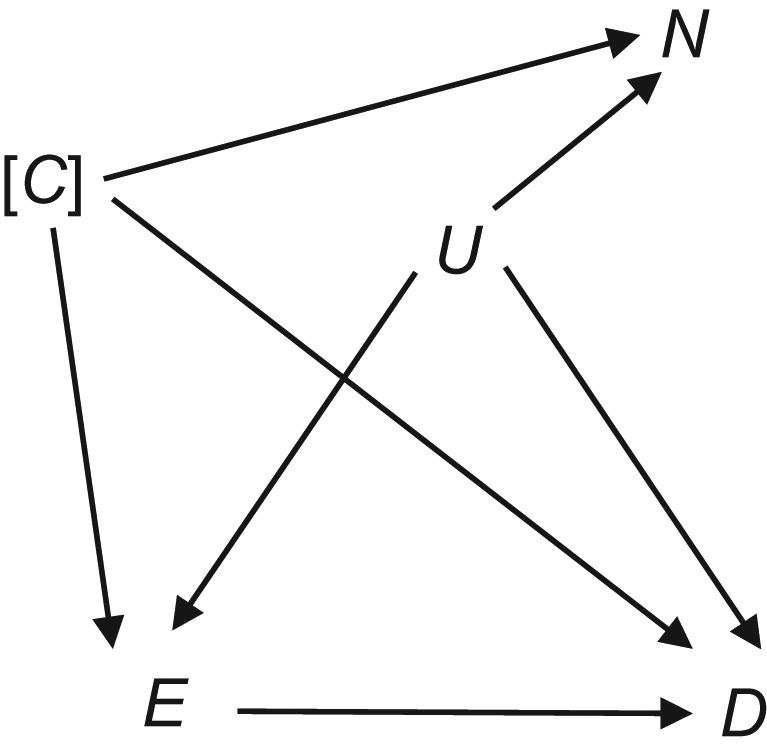
Figure 1.

Directed acyclic graph illustrating the basic principles of negative control exposure analysis. E and D are the exposure and outcome of interest, respectively. The directed acyclic graph is drawn under the assumption of a true causal association between E and D, although there may not be one (this is the question being studied). C represents a set of measured and controlled confounding variables, and U represents a set of unknown or unmeasured confounding variables. The brackets around C suggest that the variable(s) is/are controlled. N is the “negative control” variable.
