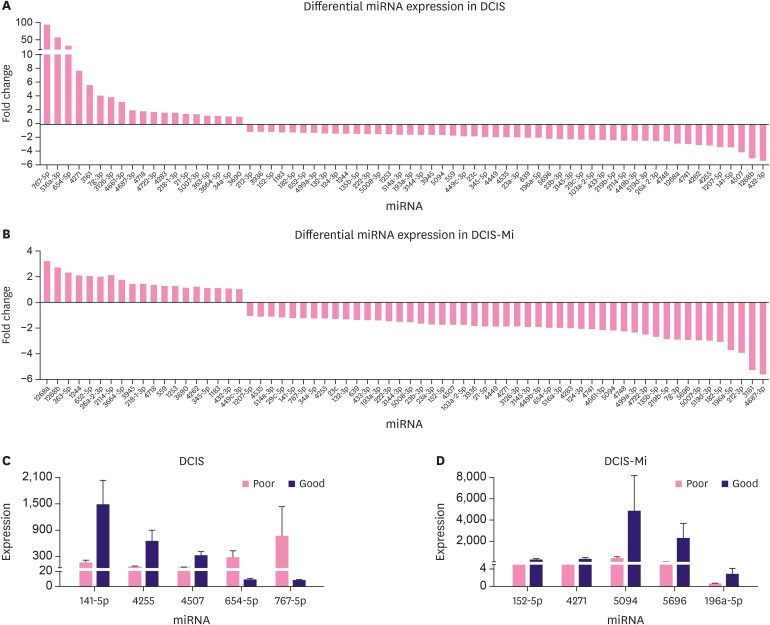
Figure 3. The screening of the distinct prognostic miRNAs by quantitative polymerase chain reaction. (A, B) The 66 miRNAs had a greater than 1.5-fold upregulated or downregulated fold-change value in DCIS and DCIS-Mi, respectively. (C, D) Five differentially expressed miRNAs were screened in DCIS and DCIS-Mi.
miRNA = MicroRNA; DCIS = ductal carcinoma in situ; DCIS-Mi = ductal carcinoma in situ with microinvasion.

