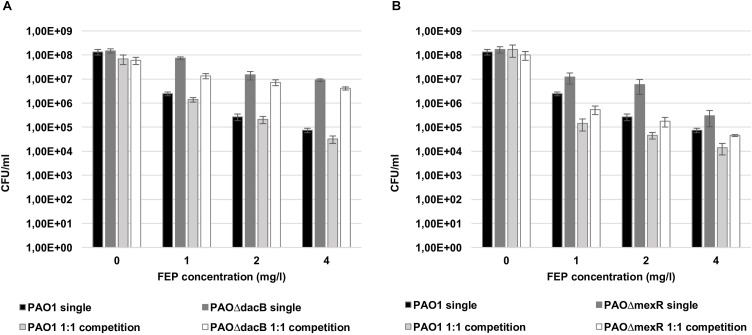
FIGURE 6.
Cell counts (CFU/ml) of PAO1 and knockout mutants (A: PAOΔdacB; B: PAOΔmexR) single or mixed planktonic cultures (1:1 initial ratio) after 24 h of treatment with FEP (0, 1, 2, or 4 mg/l). The results represent the means (bars) and standard deviations (error bars) from at least three independent experiments.

