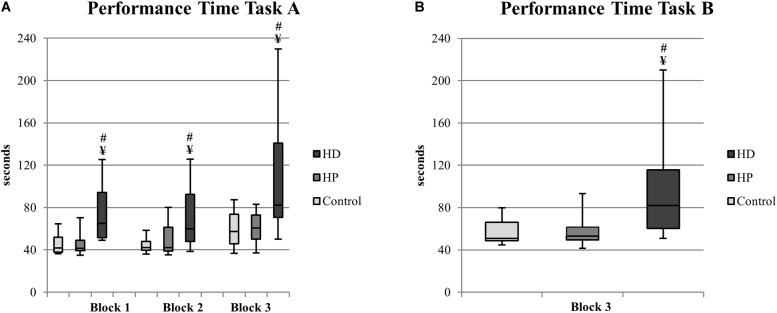
FIGURE 3.
EcoKitchen Performance Time Task A (A) and Performance Time Task B (B) and significant differences between groups. Boxplots: central mark – median; edges of box – 25th and 75th percentiles; whiskers – most extreme data points (minimum and maximum). ¥HD≠Control (Mann–Whitney, p < 0.05); #HD ≠ HP (Mann–Whitney, p < 0.05).

