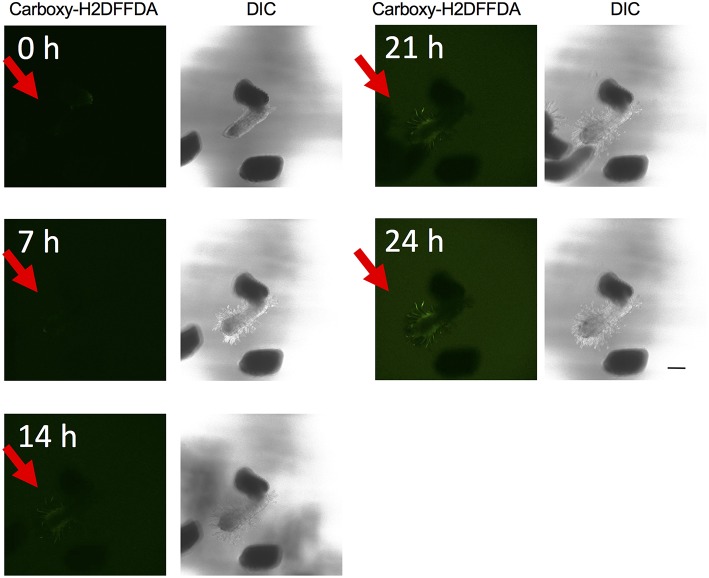
Figure 3.
Time course visualization of H2O2 accumulation. H2O2 accumulation was observed by carboxy-H2DFFDA staining (green) at 0, 7, 14, 21, and 24 h after haustorium induction by DMBQ. Each time point is composed of a fluorescence image (left) and a DIC image (right). Each image was derived from the same laser power and exposure time. Red arrows indicate S. hermonthica radicles. The scale bar indicates 200 μm.

