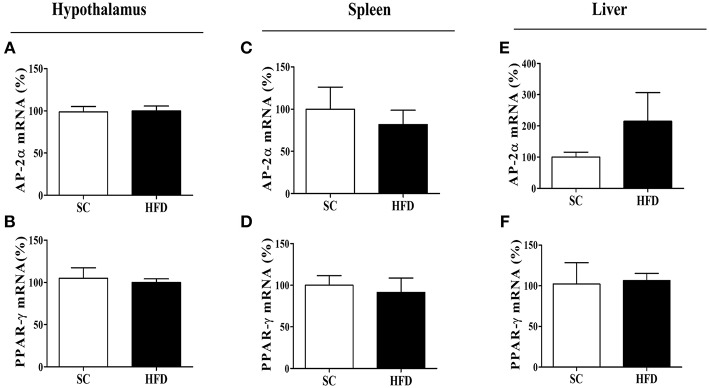
Figure 6.
mRNA expression levels of CHRNA7 transcription factors following HFD consumption. The mRNA expression levels of AP-2α (A) in the hypothalamus (SC, n = 5 and HFD, n = 5), (B) spleen (SC, n = 5 and HFD, n = 5), and (C) liver (SC, n = 5 and HFD, n = 5); the mRNA levels of PPAR-γ (D) in the hypothalamus (SC, n = 5 and HFD, n = 5), (E) spleen (SC, n = 5 and HFD, n = 5), and (F) liver (SC, n = 5 and HFD, n = 5) of mice fed SC or a HFD for 3 days. The bars represent the mean ± SEM.

