Figure 7.
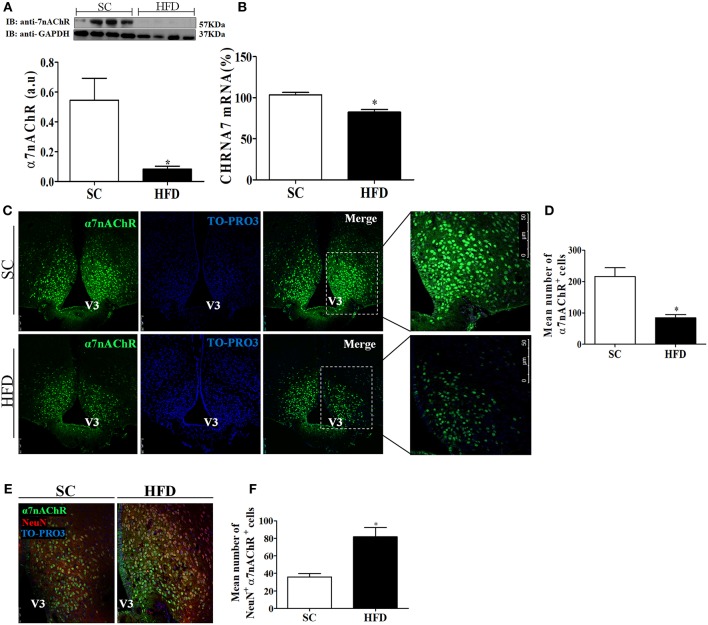
CHRNA7 expression levels in the hypothalamus following HFD consumption. (A) The protein expression levels of α7nAChR (SC, n = 4 and HFD, n = 4); and (B) The mRNA expression levels of α7nAChR in the hypothalamus of mice fed SC or a HFD for 3 days (SC, n = 5 and HFD, n = 5); (C) Confocal images illustrating α7nAChR+ cells (green) and nuclear labeling with TO-PRO-3® (blue) in coronal brain sections (15-μm) from mice fed SC or a HFD for 3 days. (D) Quantitation of the number of α7nAChR+ cells in the ARC of mice fed SC or a HFD (SC, n = 5 and HFD, n = 5). (E) Confocal images illustrating α7nAChR+ cells (green), NeuN+ cells (red), and nuclear labeling with TO-PRO-3® (blue) in coronal brain sections (15-μm) from mice fed SC or a HFD for 3 days. (F) Quantitation of the number of α7nAChR+/NeuN+ cells in the ARC of mice fed SC or HFD. V3, third ventricle. The bars represent the mean ± SEM. *Means significantly different as shown by unpaired t-tests (*p < 0.05). Scale bars: 50 μm.

