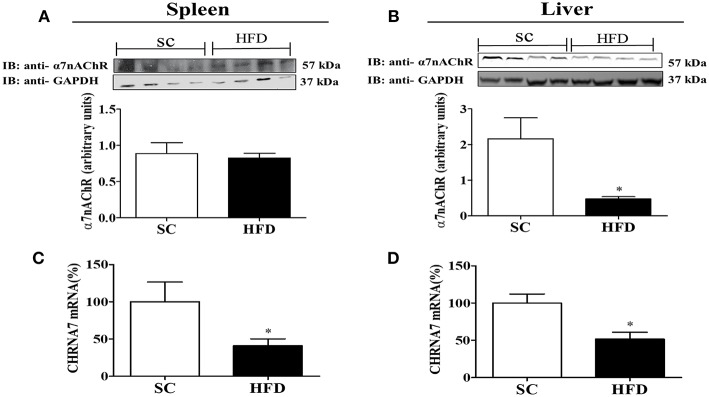
Figure 8.
α7nAChR and CHRNA7 expression levels in the spleen and liver following HFD consumption. (A,B) Protein expression levels of α7nAChR in the (A) spleen and (B) liver of mice fed SC or a HFD for 3 days (SC, n = 4 and HFD, n = 4); (C,D) α7nAChR mRNA expression levels in the spleen (C) and liver (D) of SC-fed and HFD-fed mice (SC, n = 4 and HFD, n = 4). The bars represent the mean ± SEM. *Means significantly different as shown by unpaired t-tests (*p < 0.05).

