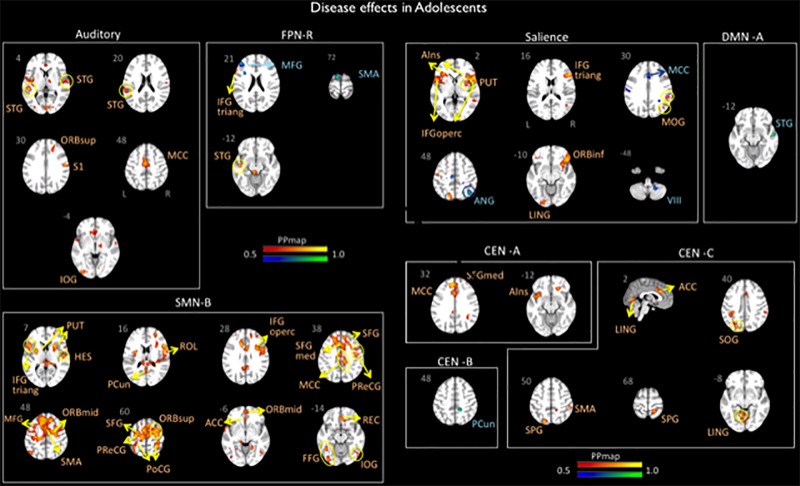
FIGURE 2.
Disease effects on rs-FC networks in the adolescents group vs. healthy controls. The figure summarizes the statistically significant changes in connectivity measured between adolescent migraineurs and their healthy controls. Changes were found in the auditory, frontal parietal right, sensorimotor B, salience, default mode A, and central executive A, B, and C networks. See text for further details and Table 4. Numbers refer to the standard MNI Atlas coordinates. Abbreviations of brain regions are described in Table 8. Red – Yellow: Increased connectivity in adolescent migraineurs vs. controls. Blue – Green: Decreased connectivity in adolescent migraineurs vs. controls.

