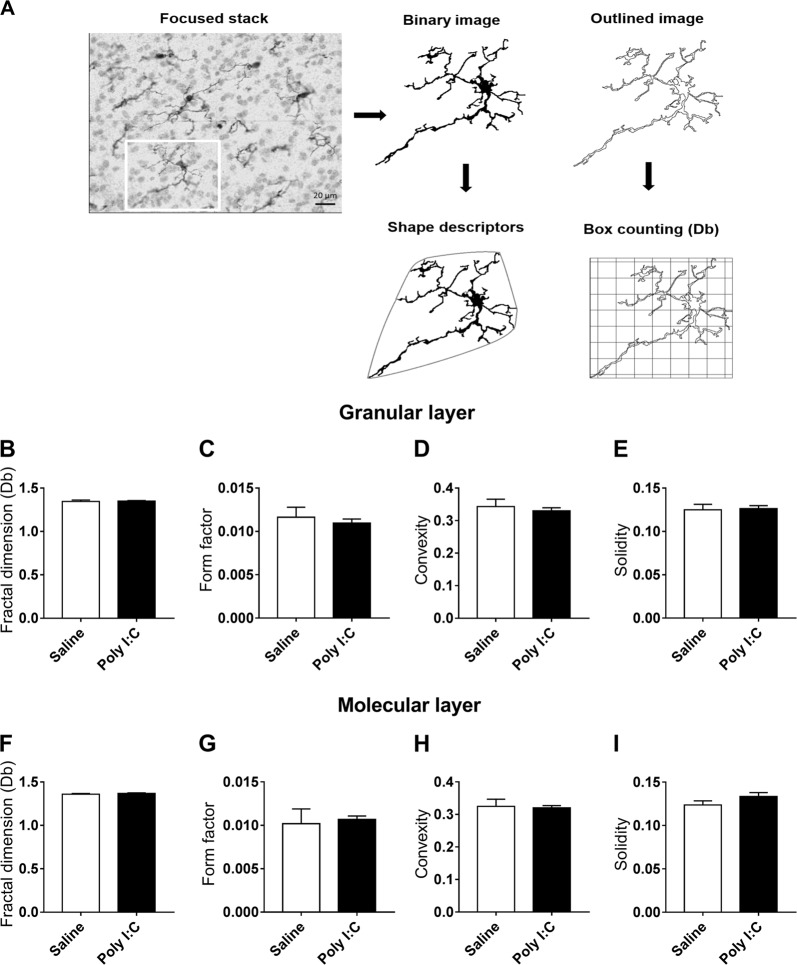
Fig. 5. Poly I:C prenatal treatment does not induce alterations in the microglial cell morphology.
a Workflow for the morphological analysis of individual Iba1 + microglial cells from DAB-staining images. Binary images were used to calculate shape descriptors and outlined images to quantify box counting fractal dimension. Quantification of fractal dimension and morphology descriptors in microglia from the sublobule Crus II of saline and poly I:C male mice in the granular layer (b–e) and in the molecular layer (f–i). Saline males n = 6; Poly I:C males n = 6. Data are presented as mean ± SEM; Data were analyzed using student’s T-test (b, f) or Mann-Whitney test (c, d, e, g, h, i) when sample did not follow a Gaussian distribution

