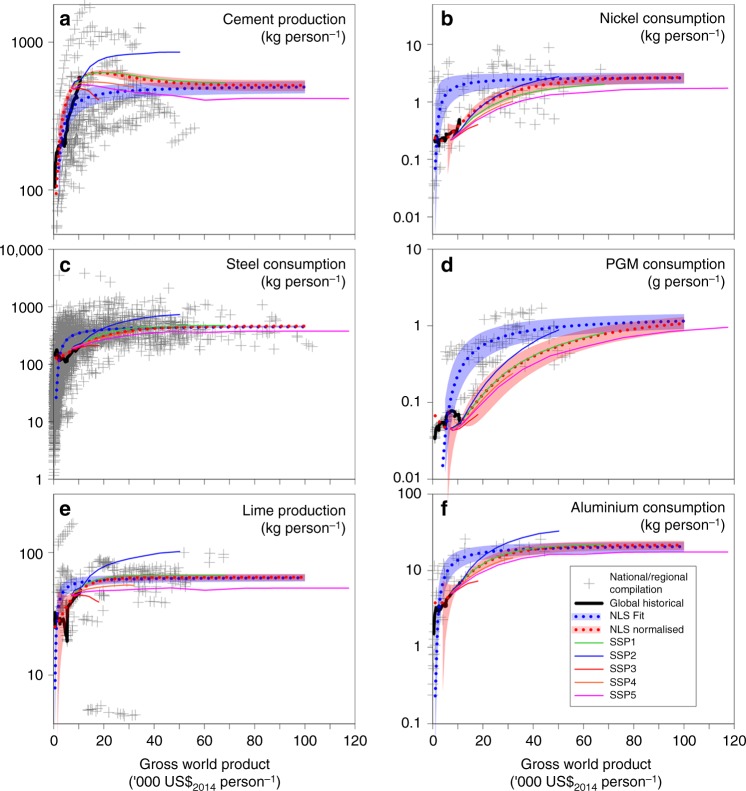
Fig. 1.
Consumption/production global saturation estimates for alkaline materials. a Cement, b nickel, c steel, d platinum group metal (PGM), e lime and f aluminium as a function of gross world product (GWP). The diagrams show a nonlinear least squares regression through compiled national data (blue dotted, the shading represents ±the standard error). The saturation value from this was fixed in an additional regression using global data relative to 2014 consumption (red dotted). Using the global fit as a baseline, the relative consumption projections for the shared socio-economic pathways (SSPs) were derived by normalising absolute changes in consumption. Production has been used for lime and cement that have a relatively small international trade market (<5%), otherwise apparent consumption has been plotted using national (slag) or regional (aluminium, PGM, nickel) data

