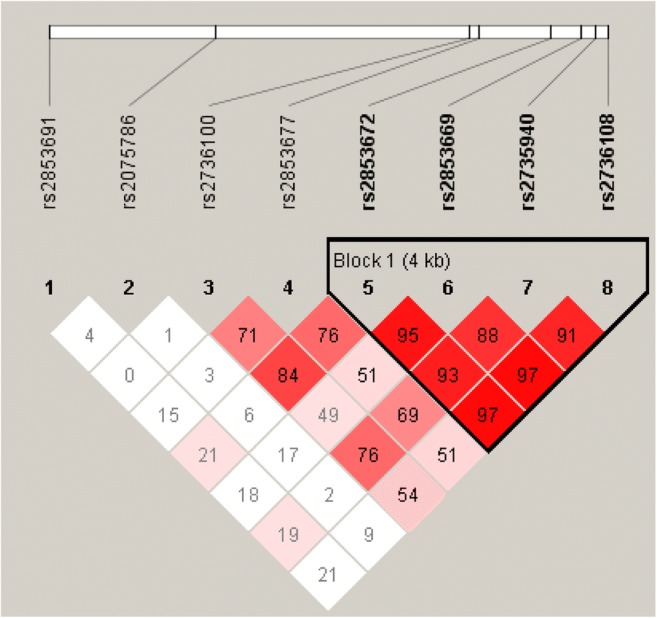
Fig. 1.

HaploBlock analysis of rs2853691, rs2075786, rs2736100, rs2853677, rs2853672, rs2853669, rs2735940 and rs2736108. The numbers in each box represent the linkage disequilibrium coefficient between the two hTERT SNPs in the upper left and upper right of the box. Dark colour boxes are representative of high linkage disequilibrium (LD), and light colour boxes indicate low LD. According to the results of the linkage disequilibrium analysis, we constructed haplotypes using rs2853672, rs2853669, rs2735940 and rs2736108 (polymorphisms 5, 6, 7 and 8, respectively) jointly
