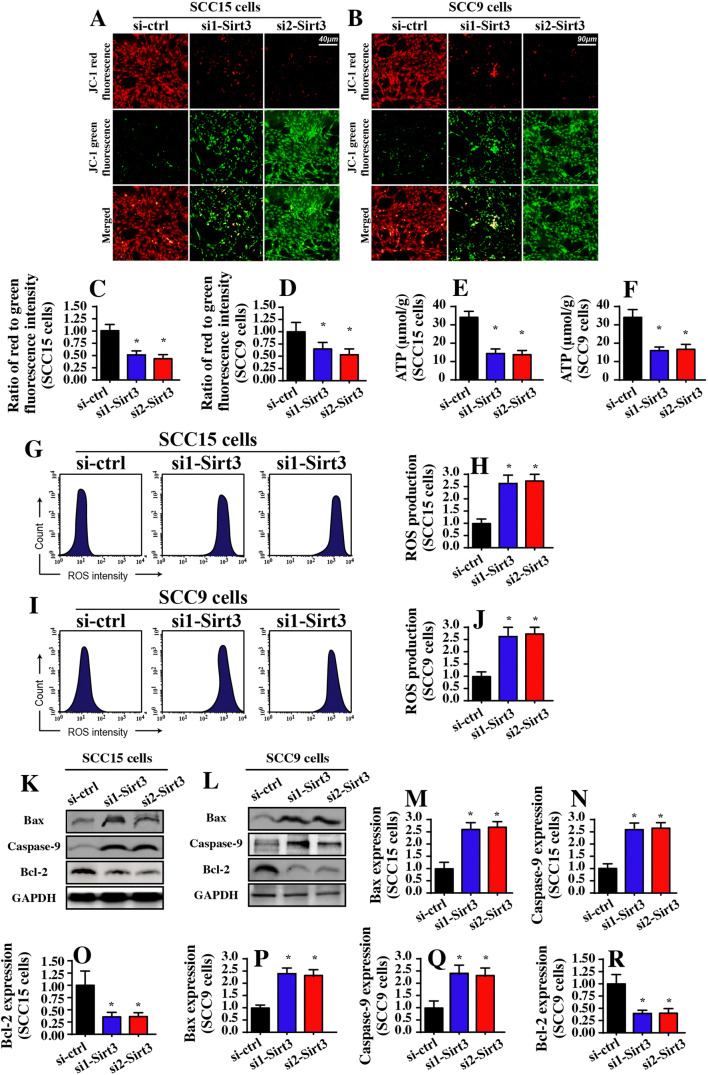
Fig. 2.
Mitochondrial apoptosis is activated by Sirt3 knockdown. a–d Mitochondrial membrane potential was observed using JC-1 staining. e and f ATP production was measured in SCC-15 and SCC-9 cells. Two independent siRNAs were transfected into SCC-15 and SCC-9 tongue cancer cells. g–j Mitochondrial ROS production was analyzed using flow cytometry. The relative ROS content was recorded as a ratio to that of the control group. k–r Western blotting was performed to analyze the expression of mitochondrial apoptotic proteins. Two independent siRNAs were transfected into SCC-15 and SCC-9 tongue cancer cells. *p < 0.05 vs. si-ctrl (control siRNA)

