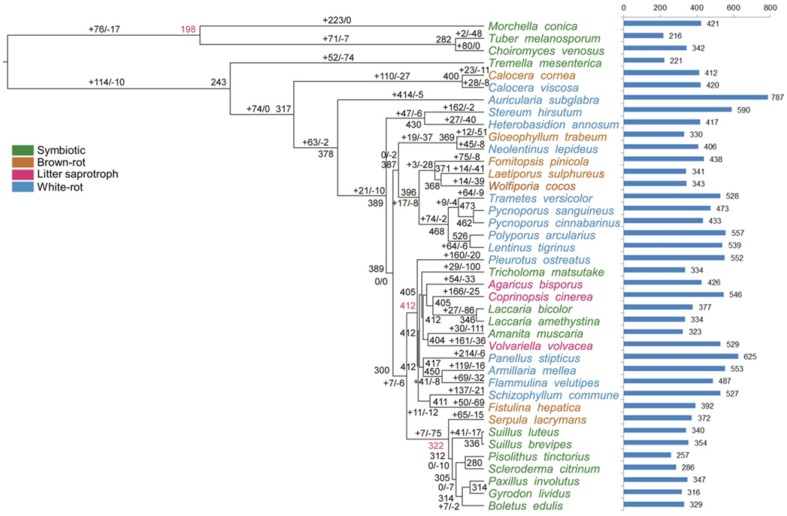
Fig. 3.
Patterns of gene duplication and loss in CAZymes gene families. Numbers at internal nodes indicate the estimated copy numbers of ancestral genes as retrieved under the best-fit BadiRate gene family turnover model (BDI-GR-ML). Numbers on the branches denote the minimum number of gains and losses estimated from the data. Bars indicate copy numbers in sampled genomes

