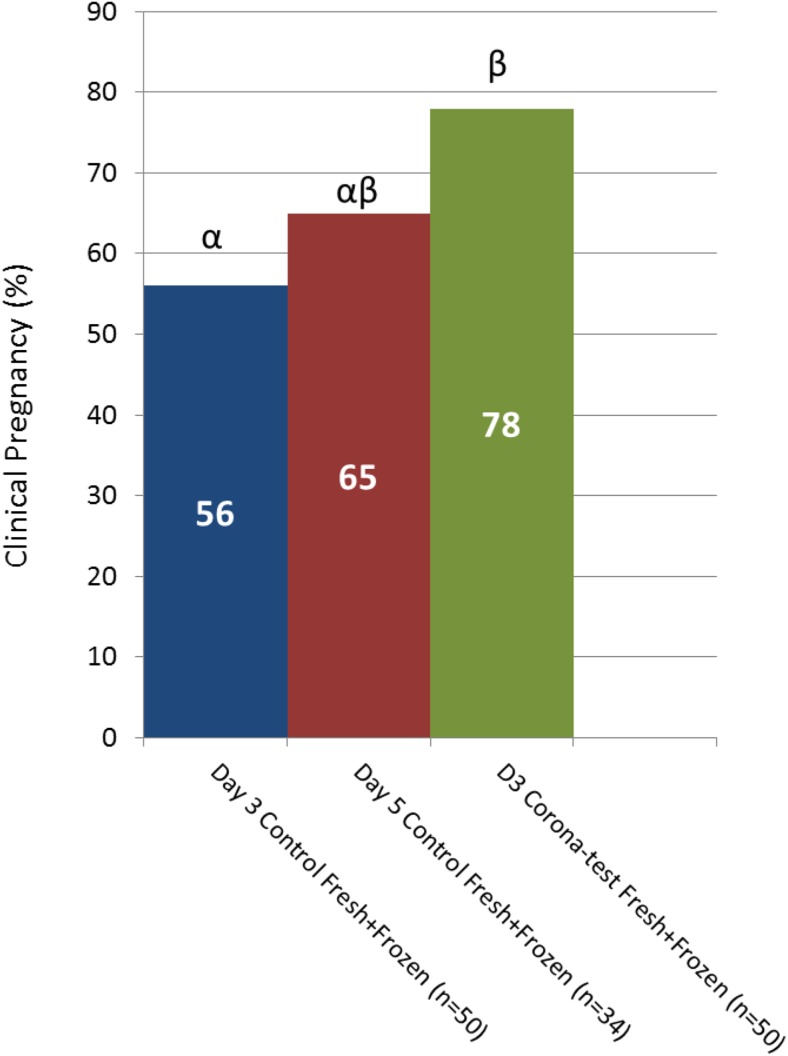
Fig. 3.
Cumulative clinical pregnancy rates. Graph depicting the clinical pregnancy from the fresh transfer and eventual clinical pregnancies obtained after the sequential frozen embryo transfers in patients which were not pregnant from the fresh transfer. The 3 groups are day 3 transfer based on embryo morphology and the Corona Test (green bars), and control patients with only morphology based embryo selection for transfer on day 3 (blue bars) and day 5 after pick-up (red bars), the numbers in the bars are the % clinical pregnancies. Comparisons were performed using the Chi square analysis between the experimental group and the 2 specific control groups and different letters indicate a statistical difference with p < 0.05

