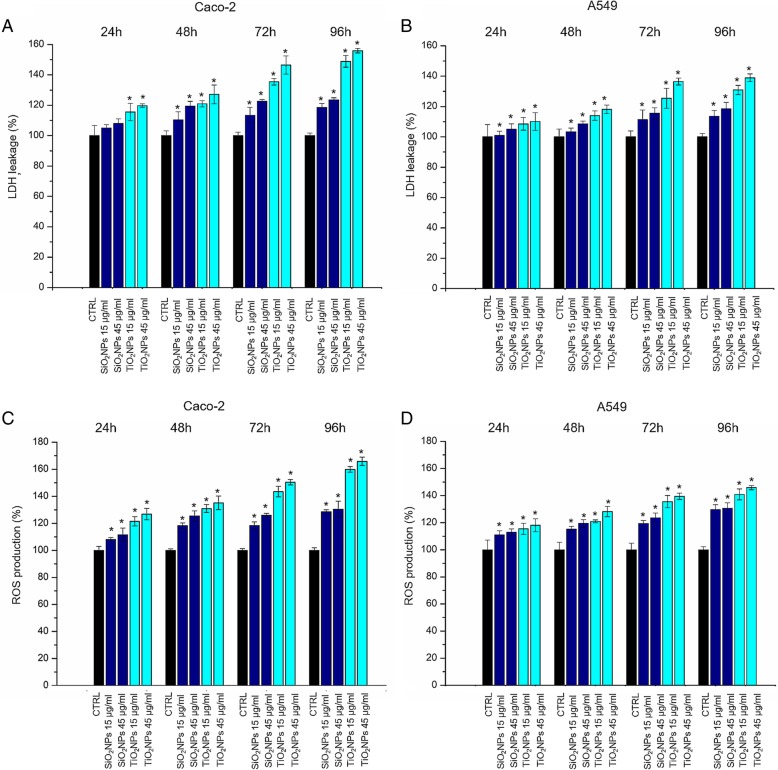
Fig. 4.
LDH (a–b) and ROS (c–d) assays on Caco-2 and A549 cells. Cells were incubated with 15 μg/ml and 45 μg/ml of TiO2NPs and SiO2NPs for 24 h, 48 h, 72 h, and 96 h. Percent of LDH leakage of nanoparticle-treated cells are expressed relative to non-treated control cells. Positive controls (P) consisted in the treatment of cells with 0.9% Triton X-100 showing ca. 500% LDH increase (data not shown). ROS levels were recorded exposing Caco-2 and A549 cells with 15 μg/ml and 45 μg/ml of TiO2NPs and SiO2NPs for 24 h, 48 h, 72 h, and 96 h incubated with 100 μM DCFH-DA. Cell fluorescence was measured. As a positive control (P), cells were incubated with 500 μM H2O2 showing a ca. 300% DCFH-DA increase (not show). Data reported as mean ± SD from three independent experiments are considered statistically significant compared with control (n = 8) for p value < 0.05 (< 0.05*, < 0.01**, and < .005***)

