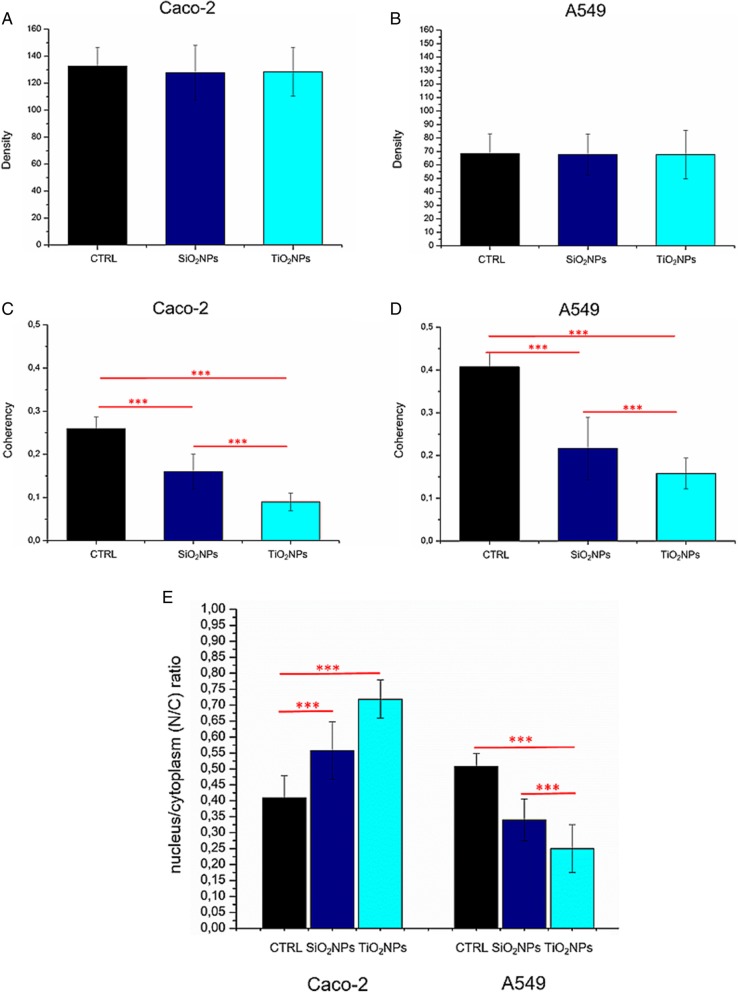
Fig. 9.
Integrated density (a, b) and coherency (c, d) for Caco-2 and A549 cells treated with 45 μg/ml of SiO2NPs and TiO2NPs after 72 h. The integrated density and coherency values were expressed as a mean value and relative SD, calculated from confocal acquisitions by ImageJ (calculation on 15 cells). The mean values and their standard deviations were reported in the histograms. Results were statistically significant for p < 0.05 (< 0.05*, < 0.01**, and < 0.005***). e Analyses of nucleus/cytoplasm ratio on Caco-2 and A549 after exposure to 45 μg/ml of SiO2NPs and TiO2NPs for 72 h. The ratio was calculated on 15 cells by ImageJ. The mean values and the SD were reported in the histogram. Results were statistically significant for p < 0.05 (< 0.05*, < 0.01**, and < 0.005***)

