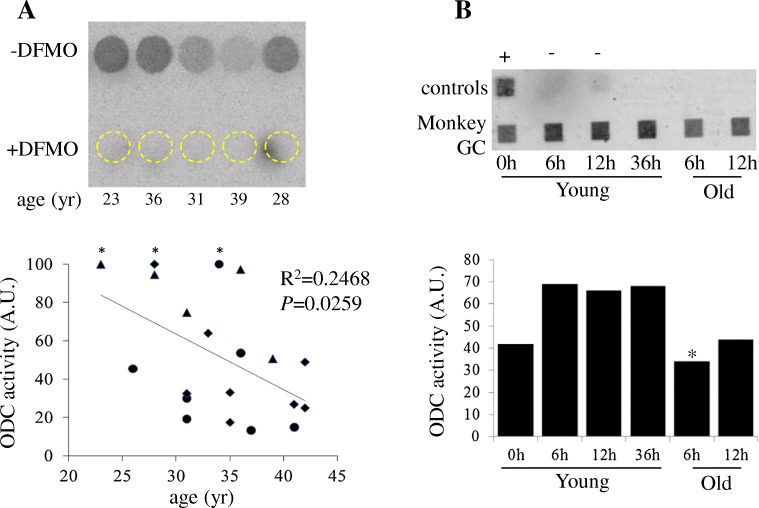
Fig. 3.
Granulosa cell ODC activity in human and monkey. a An inverse relationship between granulosa cell ODC activity and maternal age. The image shows the result of the first assay where the granulosa cell extract from each patient was split equally into two, analyzed in the absence or the presence of DFMO (ODC inhibitor). Dark circles depict PhosphorImager scan of 14CO2 release from decarboxylation of 14C-ornithine (-DFMO). Corresponding positions of the reaction in the presence DFMO are depicted by dashed circles. The graph summarizes data of three experiments (triangle, diamond, or circle), with a total of 20 patients aged 23 to 42. ODC activities are expressed in arbitrary unit, normalized by total protein concentrations in the cell lysates in each of the three experiments, and with the highest ODC activity sample (marked with a star) in each experiment arbitrarily set as 100. Data are analyzed using GraphPad Prism 6.02. b Monkeys underwent controlled ovarian stimulation [55]. At the indicated time following hCG injection, follicle aspiration was carried out. After oocyte removal, granulosa cells (GC) were purified using Percoll gradient centrifugation [50], counted, and snap-frozen in liquid N2. Cell extracts were prepared and subjected to ODC activity assay, each reaction representing 1 million cells with the exception of the indicated (*) reaction (830,000; max available). The image shows PhosphorImager scan of the single assay, with each sample representing a single aspiration (both ovaries) at the indicated time after hCG injection. The graph shows relative ODC activity in arbitrary units. +, Xenopus egg extract; −, buffer only

