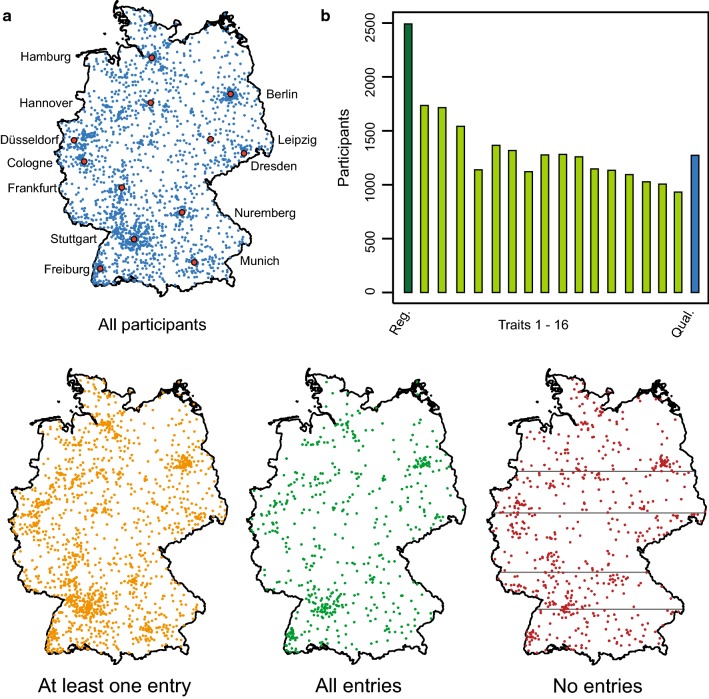
Fig. 2.
Geographic distribution of the participants and trait assessment. a The maps show Germany with all 2492 participants, those who scored at least one trait and entered it online in the database (n = 1790), those who scored all traits (n = 557), as well as those without any entry in the online database (n = 702). The grey horizontal lines in the latter indicate the latitudinal regions considered during randomization. b Number of participants scoring each of the 16 traits (the numbering refers to Table 1) and sending samples back for quality analysis (Qual.)

