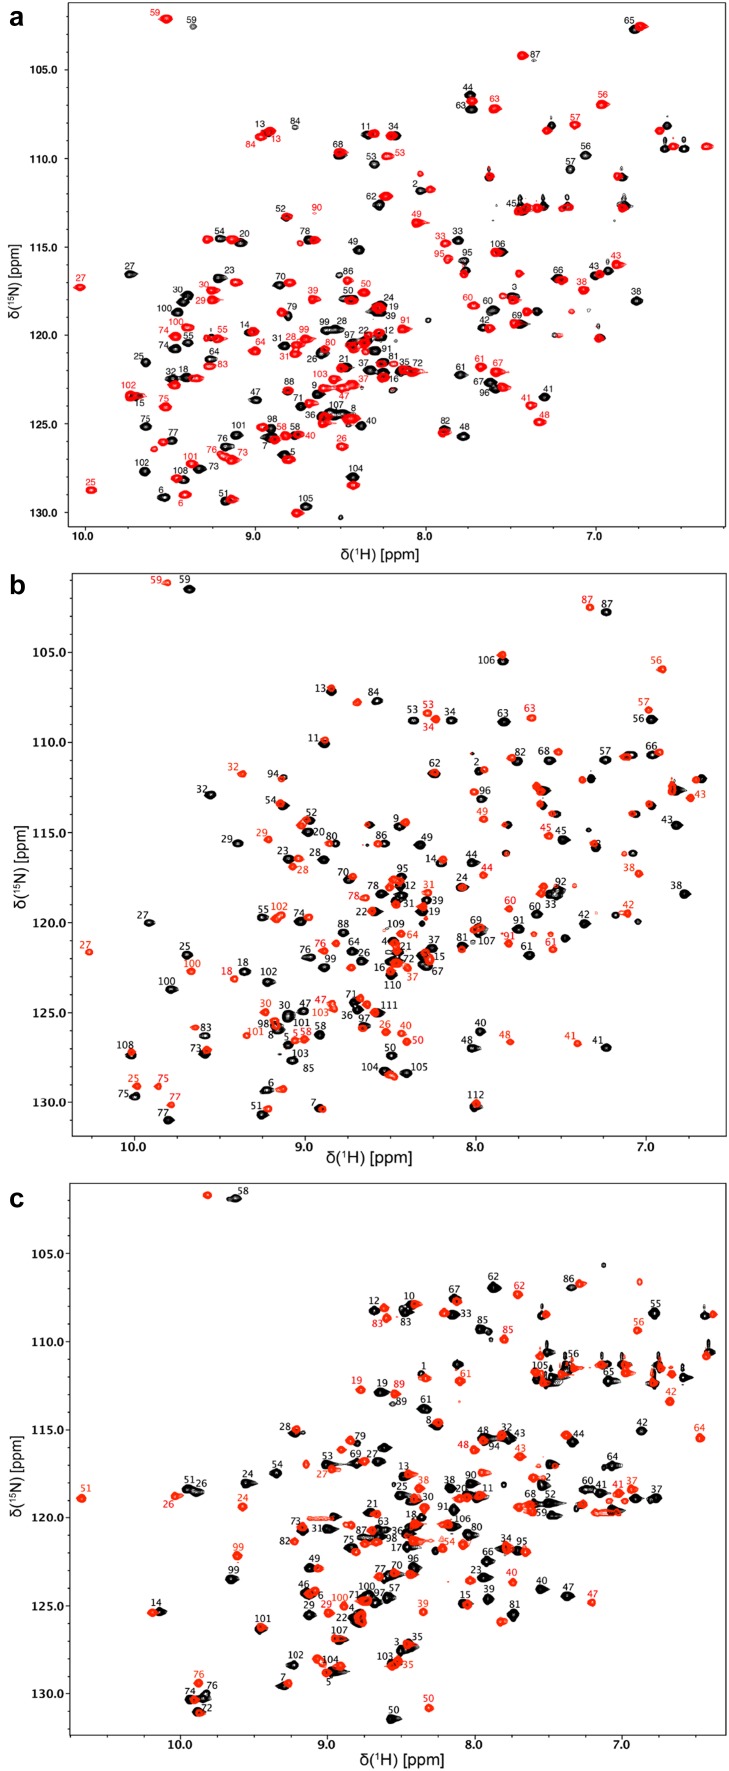
Fig. 2.
Two-dimensional 1H–15N HSQC spectra. aM. circinelloides, bA. fumigatus, and cH. sapiens FKBP12 in the apo and FK506 bound forms. Assigned peaks for the apo (black) protein are labeled. Only select peaks in the FK506 bound (red) spectrum are labeled to indicate crosspeaks with significant binding shifts or for assignment clarity

