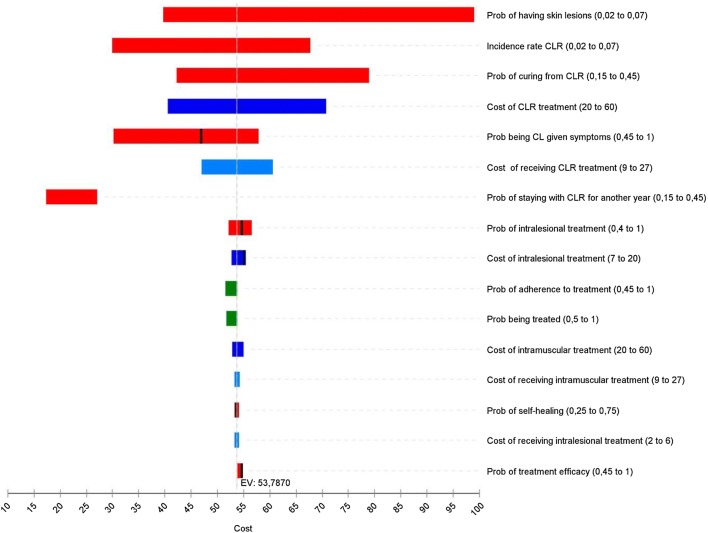
Fig. 4.
Tornado diagram. Parameter categories are grouped by color: dark blue represents costs borne by the health system; light blue represents costs borne by the suspects/patients with cutaneous leishmaniasis (CL); red represents transition rates; and green represents patient/clinician behaviours. The values in the parentheses stand for the lower and higher range over which the parameter was varied. The vertical line represents the expected value of the microscopy cost. A segmented bar indicates a change in the cost threshold: CL Detect™ Rapid Test becomes cheaper than microscopy. CLR cutaneous leishmaniasis recidivans, EV, Prob probability

