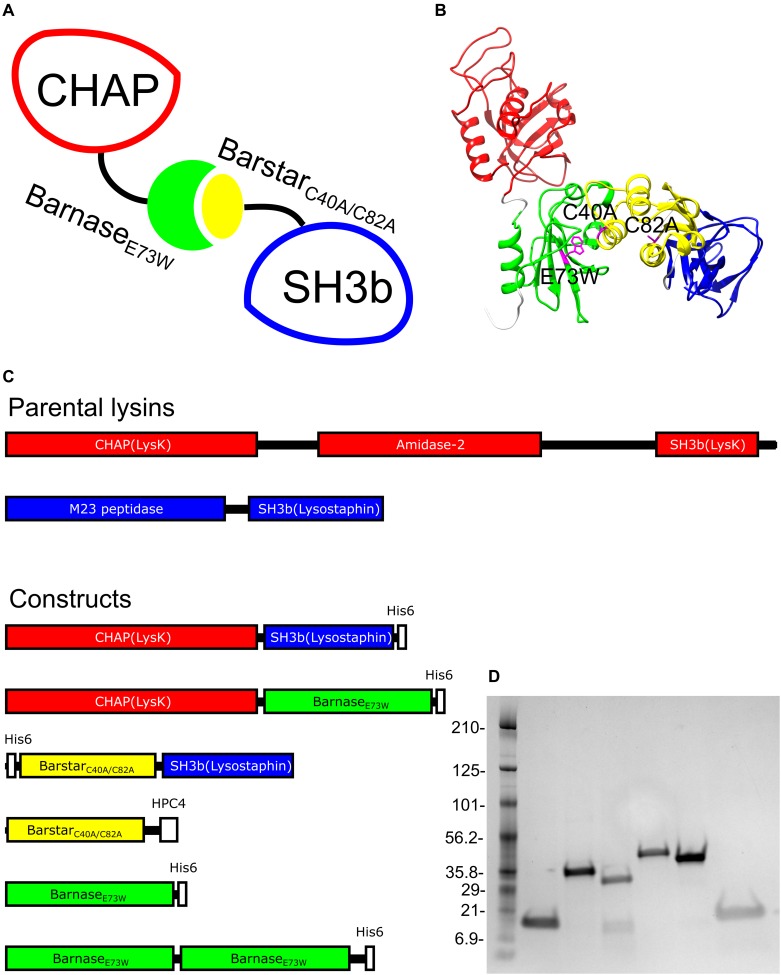
FIGURE 1.
(A) Schematic sketch of protein complex, (B) structure prediction of complex made using I-TASSER (Zhang, 2008) with mutations highlighted in magenta. (C) Representations of parental lysins and protein constructs designed for this study. The parental endolysin LysK and the derived CHAPK domain is in red. The parental Lysostaphin and its derived SH3b domain are in blue. Barnase and barstar are in green and yellow, respectively. (D). SDS–PAGE of protein constructs. From left to right: ladder, BarnaseE73W, BarnaseE73W-BarnaseE73W, BarstarC40A/C82A-SH3b, CHAP-BarnaseE73W, CHAP-SH3b, and BarstarC40A/C82A.

