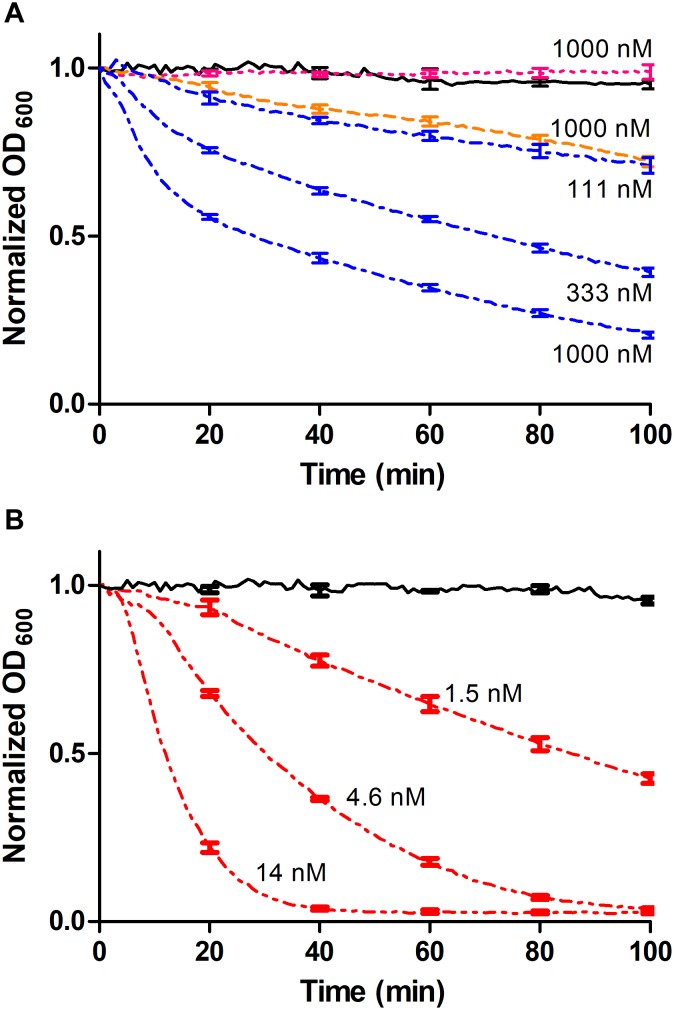
FIGURE 4.
Turbidity reduction assays (TRA). Data points were collected every minute and error bars representing standard deviation is shown each 20 min for intelligibility. (A) The CHAP-BarnaseE73W/BarstarC40A/C82A-SH3b complex was used at concentrations of 1000, 333, and 111 nM, respectively (blue dashed/dotted line). The non-complexed controls BarstarC40A/C82A-SH3b (cyan dotted line) and CHAP-BarnaseE73W (orange dashed line) were used at a concentration of 1 μM and PBS (black continuous line) was used as negative control. (B) The CHAP-SH3b gene fusion had a concentration of 14, 4.6, and 1.5 nM, respectively (red dashed/dotted/dotted line) and PBS (black continuous line) was used as negative control.

