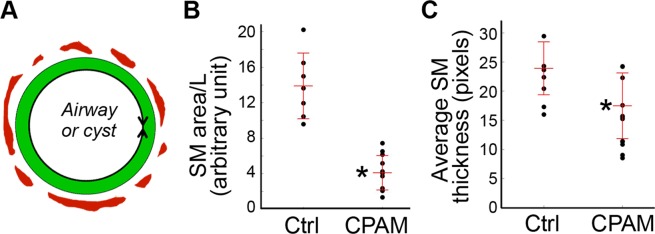
Figure 3.
Semi-quantitative measurements and comparisons of airway smooth muscle layers. (A) Schematic illustration for average smooth muscle (SM, red) thickness and SM area. The mucous epithelial layer is marked as green. The mucous membrane length (L, shown as a double arrow line) was used for normalization. (B) Sum smooth muscle area normalized by mucous membrane length shown as a dot plot, with the bars indicating mean ± se. (C) Average smooth muscle layer thickness measurement shown as a dot plot, with mean ± se. (B,C) Comparisons were performed between cystic airways of type 2 CPAM samples (n = 13) and normal bronchioles in control lungs (Ctrl, n = 7) using non-parametric Mann-Whitney U test. *P < 0.05.

