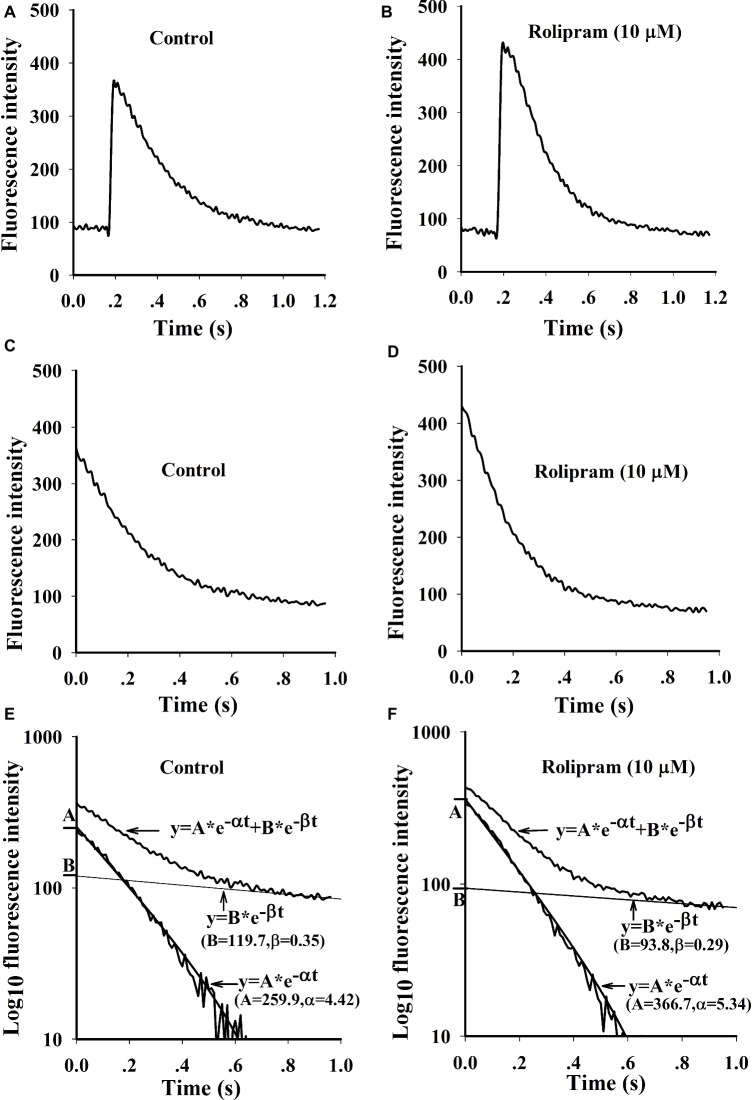
Figure 5.
Representative curves of Ca2+ transients induced by field stimulation and the fittings by two exponential equations. (A and B) are original Ca2+ transient curves triggered by field stimulation before and after rolipram (10 μM). (C and D) are decaying phase curves of Ca2+ transients by deleting the fast rise phase before and after rolipram (10 μM). The decay phase curves and fittings are presented as the relationships of timing of ms in X axis to the log10 fluorescence intensities in Y axis before (E) and after rolipram (10 μM) (F). The decaying phases are expressed as an equation of y = A*e−αt + B*e−βt. The equation in fast component is described as y = A*e−αt and slow one as y = B*e−βt.

