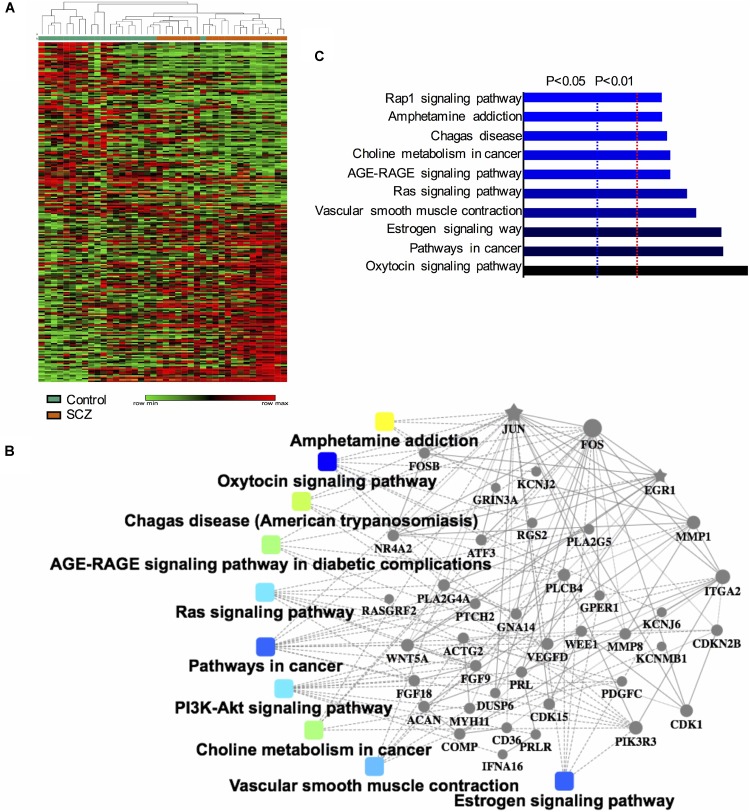
FIGURE 1.
Identification and functional analysis of 250 differentially expressed genes (DEGs) between schizophrenia and healthy control samples in GEO dataset GSE62333. (A) Heatmap showing 250 DEGs (| FC| > 1.3, p-value < 0.05) between schizophrenia and control samples. Each column represents the expression level of a gene, and each row represents a sample. The color scale below the heatmap represents the raw Z-score ranging from green to red (low to high expression level). Dendrograms above correspond to the Pearson correlation-based hierarchical clustering of the 250 genes. (B) Associated KEGG signaling pathways of the 250 DEGs. The network model generated by Omics Bean illustrates the results of KEGG pathway and biological process enrichment analysis. (C) A histogram according to the KEGG functional analysis displaying the percentage of genes affected in these pathways.

