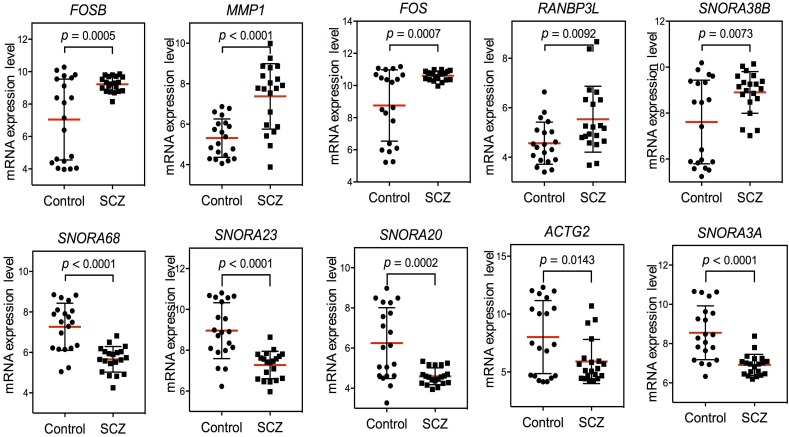
FIGURE 2.
Scatter plot of expression levels of the identified top 10 differentially expressed genes (DEGs) in GEO dataset GSE62333. The top five up-regulated genes (FOSB, MMP1, FOS, RANBP3L, and SNORA38B) and top five down-regulated genes (SNORA68, SNORA23, SNORA20, ACTG2, and SNORA3A) were arranged by degree of change. Detailed information on these genes is listed in Table 1.

