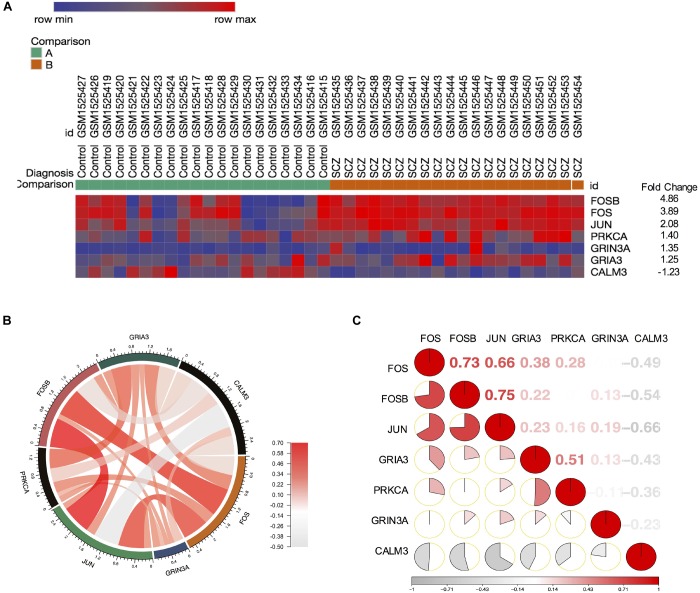
FIGURE 4.
FOS was positively correlated with FOSB, JUN, and GRIA3 in the amphetamine pathway in GEO dataset GSE62333. Spearman correlation of related gene expression levels of fold changes were calculated for further analysis. (A) Heatmap showing genes involved in the amphetamine pathway from 1,022 probes with significantly different gene expression levels (using the R package “pheatmap”). (B) Correlation between FOS and other genes in the amphetamine pathway (FOSB, JUN, PRKCA, GRIA3, GRIN3A and CALM3). (C) Corrgram shows the correlation of FOS with other six genes in the amphetamine pathway. The cells of the matrix were shaded to show the correlation value. The correlation r-value between FOS and six genes in the amphetamine pathway were FOSB (r = 0.73, p = 1.02E-07), JUN (r = 0.66, p = 0.000003) GRIA3 (r = 0.38, p = 0.014374), PRKCA (r = 0.28, p = 0.001441), GRIN3A (r = –0.006, p = 0.966528), CALM3 (r = –0.49, p = 0.001441), respectively.

