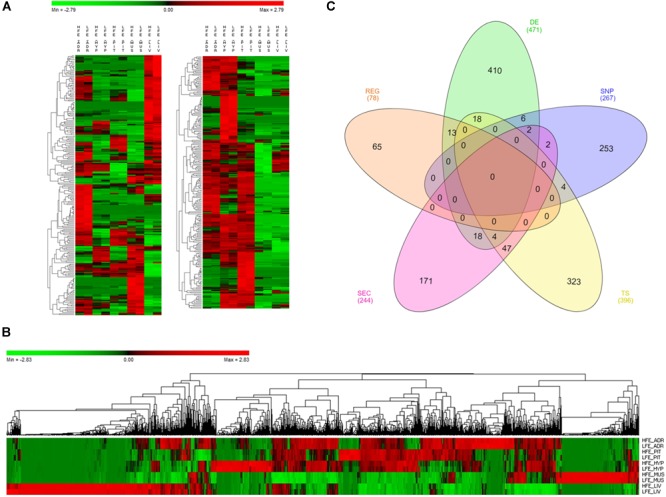
FIGURE 1.

Genes selected for co-expression network construction. (A) Heatmap of normalized mean expression (NME) of 471 differentially expressed (DE) genes between high (HFE) and low (LFE) feed efficient animals in adrenal gland (ADR), hypothalamus (HYP), liver (LIV), muscle (MUS) and pituitary (PIT). Genes (rows) and samples (columns) are organized by hierarchical clustering based on Euclidean distances. (B) NME heatmap of all 1,335 genes selected for network construction. Genes (columns) and samples (rows) are organized by hierarchical clustering based on Euclidean distances. (C) Venn diagram of 1,335 genes selected for network construction. The inclusion criteria for selecting genes were divided into five categories: differentially expressed genes (DE), tissue specific genes (TS), genes harboring SNPs reported in literature as being associated with feed efficiency in beef cattle (SNP), genes encoding proteins secreted by at least one of the tissues in plasma (SEC) and key regulators (REG). Numbers between brackets indicate the total number of genes in each category.
