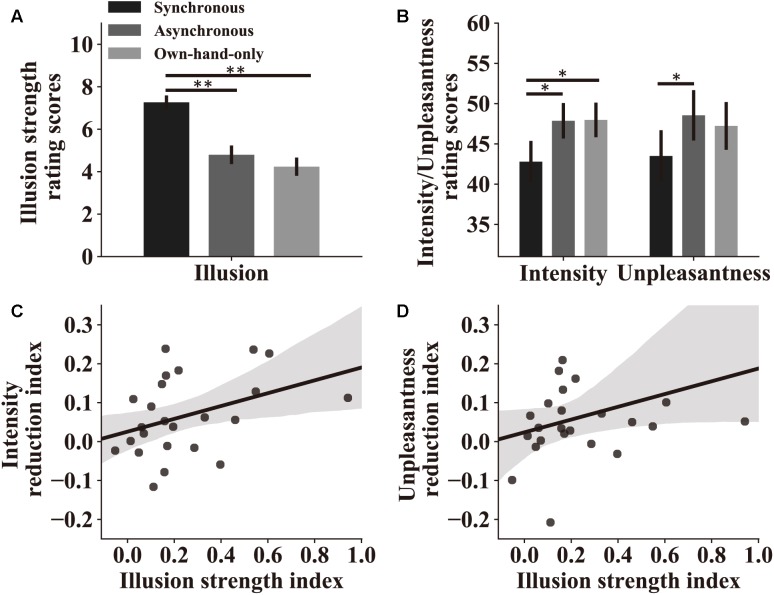
FIGURE 3.
Attenuation by the RHI on perceived pain intensity and unpleasantness. (A) Rating scores of the RHI strength in the main experiment. Results indicate that three stroking conditions indeed produce different levels of the RHI. (B) Rating scores of pain intensity and unpleasantness in the three stroking conditions. Both scores reflect the level of perceived pain, which is lower in the synchronous condition compared to the other two conditions. For both (A,B), significant symbol conventions are ∗p < 0.05; ∗∗p < 0.01. (C) Pain intensity reduction index reflects the strength of the analgesic effect in the synchronous condition compared to the asynchronous condition. A larger value represents a stronger analgesic effect (see section “Materials and Methods”). Pain intensity reduction indices of individual subjects are significantly correlated with their illusion strength indices (r = 0.42, p = 0.040), which reflect the difference of the RHI strength in two stroking conditions (see section “Materials and Methods”). (D) Pain unpleasant reduction indices and illusion strength indices show a trend in correlation analysis at the individual level (r = 0.33, p = 0.11) similar to the analysis of pain intensity. For both (C,D), the shaded area represents the 95% confidence interval for correlations.

