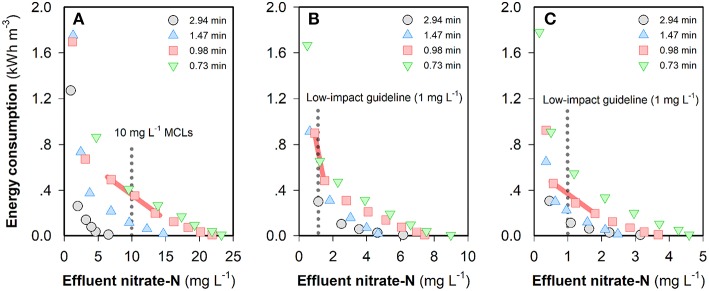
Figure 3.
Energy consumption to obtain different “steady-state” NO3-N concentrations when the feed water contains (A) 50, (B) 20, or (C) 10 mg NO3-N L−1. The legends in the figures indicate different HRTs. Experimental conditions: single-pass, constant-current mode, flow electrode = 10 wt% carbon in 1,000 mg NaCl L−1 electrolyte and operating time = 1,200~1,800 s. The standards and low-impact guidelines refer to the MCLs in Ward (2005) and Hickey (2013).

