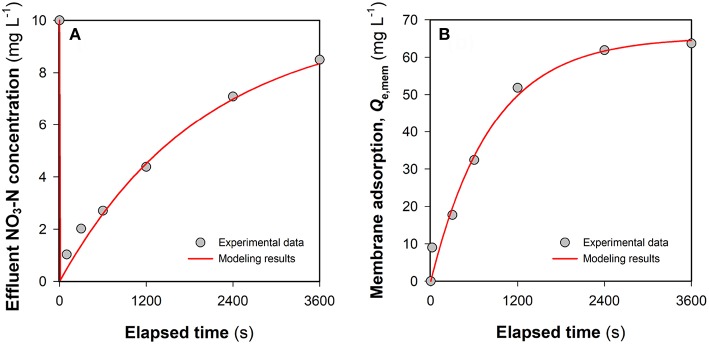
Figure 4.
Evaluation of the contribution of membrane adsorption to NO3-N removal in FCDI: (A) Change of the effluent NO3-N concentration and (B) mass balance of NO3-N removal. The red lines indicate the results of pseudo-first-order kinetic modeling. The system was operated in single-pass mode at i = 0 A m−2. Experimental conditions: influent NO3-N concentration = 10 mg L−1 and HRT = 0.98 min.

