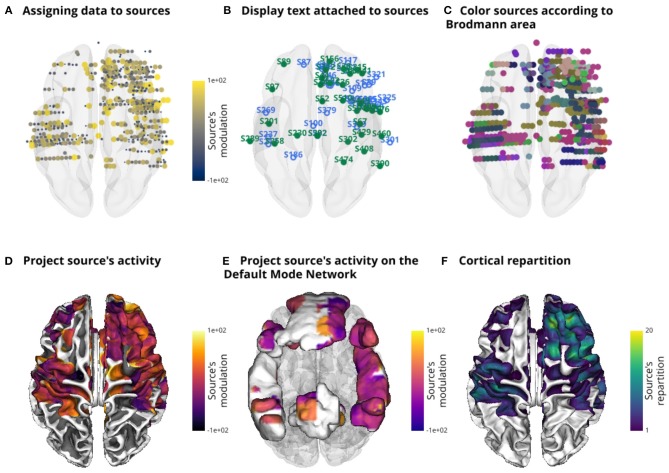
Figure 4.
Illustration of the main features of the source object (SourceObj) using an intracranial dataset. Additional data can be assigned to sources and the color can either be individually defined or based on a colormap (A). A text can also be attached to sources (B). In a similar way to Figure 3D, here, sources are colored according to Brodmann areas (C). The data attached to sources in (A) is then projected onto the surface of the brain (D) or onto the surface of the default mode network (DMN) (E). Finally, the cortical repartition (F) is the number of contributing sources per vertex. It can be an interesting feature to estimate the number of sources that have contributed to each point of the cortical mesh when projecting source's data.

