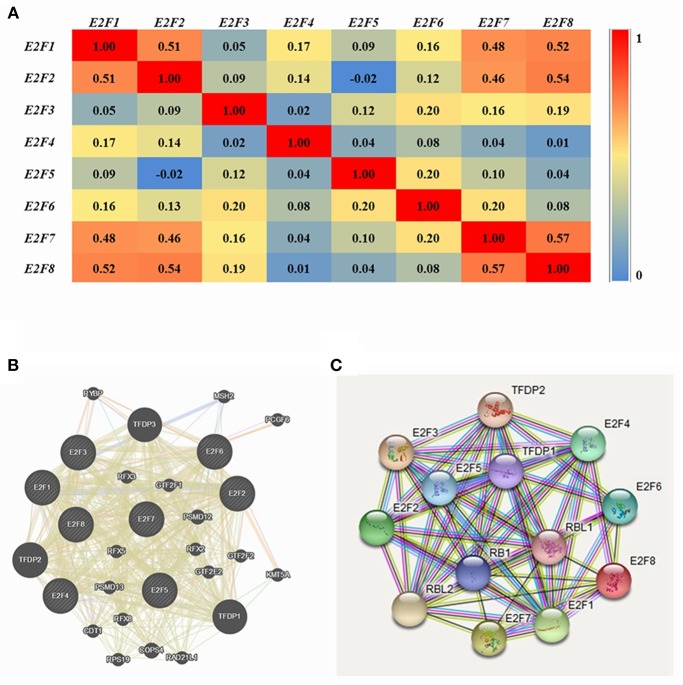
Figure 4.
Co-expression and interaction analysis of E2F family members at the gene and protein levels in patients with OC (cBioPortal and GeneMANIA). (A) Pearson correlation of E2F family members. (B) Gene–gene interaction network among E2F family members in the cBioPortal dataset. (C) Protein–protein interaction network among E2F family members in the GeneMANIA dataset.

