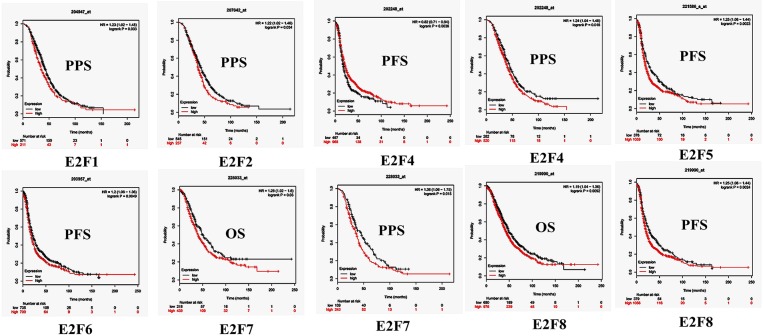
Figure 7.
The prognostic value of mRNA level of E2F family members in OC patients (Kaplan–Meier plotter). The OS, PFS, and PPS survival curves comparing patients with high (red) and low (black) E2F family member expression in OC were plotted using Kaplan–Meier plotter database at the threshold of p-value of < 0.05.

