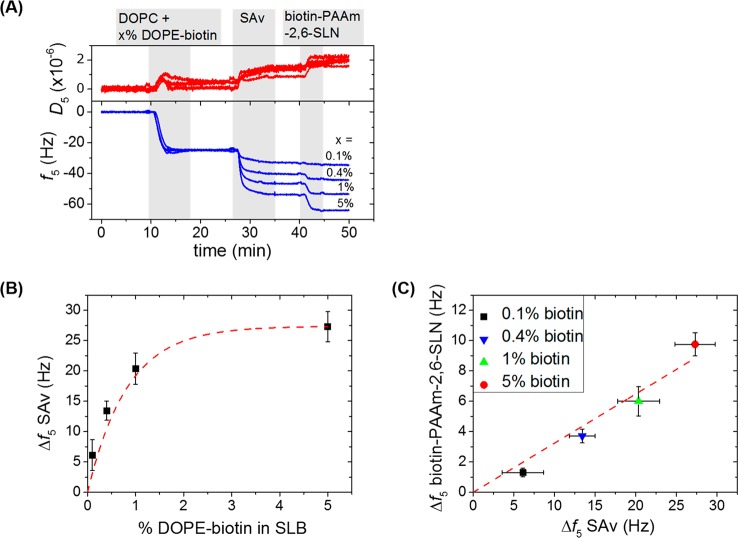
Figure 2.
Control over the SLN density at the SLB platform. (A) Example of four parallel QCM-D measurements showing SLB formation using DOPC vesicles with a molfraction x (0.1, 0.4, 1, and 5%) of DOPE-biotin followed by binding of SAv (0.5 μM) and subsequently of biotin-PAAm-2,6-SLN (4 μg/mL). Gray areas indicate the binding steps and white areas indicate buffer wash steps. All steps are under flow. (B) Correlation between QCM-D frequency shifts (Δf5, 5th overtone) of SAv binding as a function of the DOPE-biotin fraction. The red dashed line is a guide to the eye. (C) Correlation between QCM-D frequency shifts of the biotin-PAAm-2,6-SLN binding as a function of the frequency shift for SAv binding. The red dashed line is a linear fit to the data points.

