Figure 1.
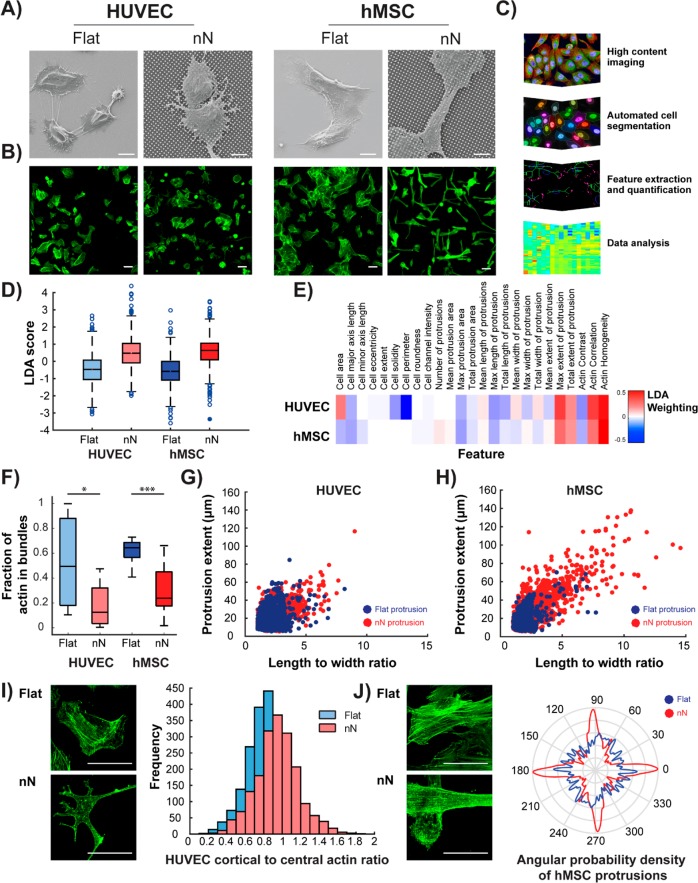
Nanoneedle interaction with HUVECs and hMSCs reduces actin bundling and enhances actin-rich protrusions. (A) SEM images show direct interaction between cells and nN 6 h postseeding. Scale bars = 10 μm. (B) Wide-field immunofluorescence images of the actin cytoskeleton show drastic alterations to cell morphology on nN as compared to that on flat controls (green: phalloidin). HUVECs display a stellate morphology on nN, whereas hMSCs elongate along the nN array. Scale bars = 50 μm. (C) Workflow for extraction, quantification, and analysis of morphometric features using high-content imaging and automated cell segmentation algorithms. (D) Twenty-five features are compared by linear discriminant analysis (LDA) for the two cell types on the flat and nN substrates, and (E) most heavily influenced parameter measured is actin homogeneity. (F) Specific analysis of actin features reveals reduced stress fiber formation (actin bundling) on nN, compared to that on flat substrates for both cell types (box plots, minimum/maximum). (G,H) Image analysis quantification of actin features reveals longer protrusions with high aspect ratios on nN. (I) HUVECs exhibit increased levels of cortical versus central actin on nN (green: phalloidin). (J) hMSC actin cytoskeleton aligns to the nN array lattice. (I,J) Deconvolved maximum projection confocal immunofluorescence images (green: phalloidin). Scale bars = 50 μm. N ≥ 3 experimental replicates for all data; *p < 0.05, ***p < 0.001 between indicated groups.

