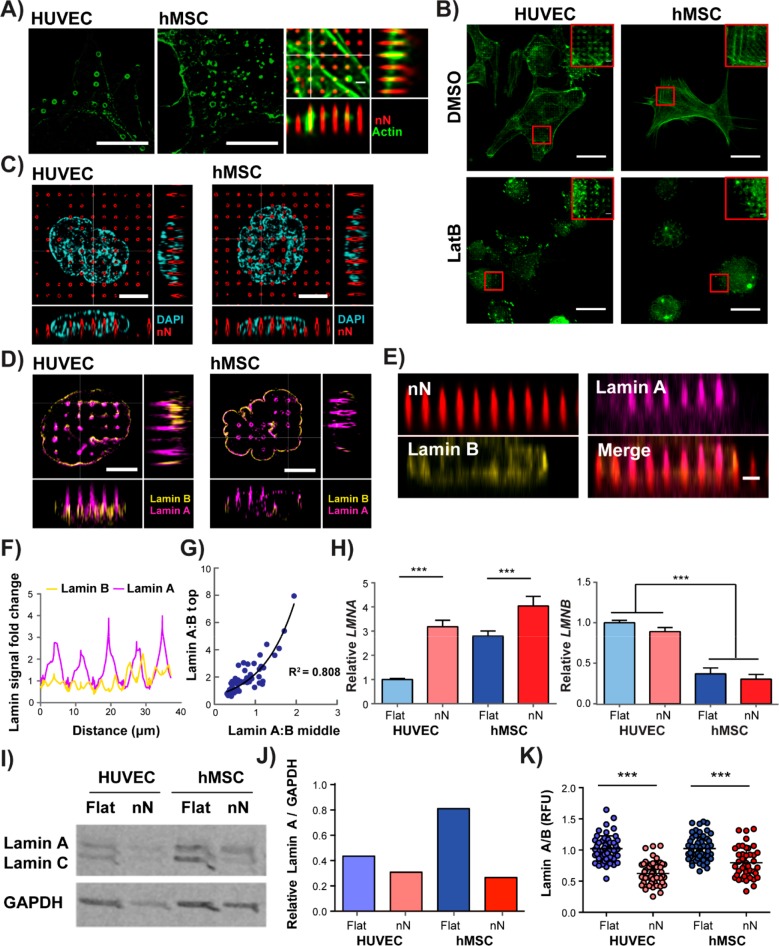
Figure 4.
Nanoneedles interact with mechanoresponsive organelles. (A) Polymerized actin rings form at sites of nN interaction with both HUVECs and hMSCs, (HUVEC: structured illumination microscopy (SIM), single plane; hMSC: deconvolved confocal microscopy, single plane). Green: phalloidin, scale bars = 10 μm. Actin rings were located around the nN (deconvolved confocal z-stack; green: phalloidin, red: nN). Scale bar = 1 μm. (B) Confocal images demonstrate that actin rings still form even when cells are treated with the actin depolymerizing agent, LatB, for the entire 6 h culture period. (Green: phalloidin, single plane). Scale bars = 25 μm. (C) SIM of DAPI-stained nuclei and fluorescent nN shows physical displacement of the nucleus at nN sites (single plane; cyan: DAPI, red: nN). Scale bars = 5 μm. (D) SIM imaging shows lamin B distributing at the base of the nN, with lamin A localising throughout the needle length. (single plane; magenta: lamin A, yellow: lamin B). Scale bars = 5 μm. (E) Reslice images of the x−z plane from confocal z-stack images; lamin A signal increases around nN, whereas lamin B remains constant (red: nN, yellow: lamin B, magenta: lamin A). Scale bar = 2 μm. (F) Analysis of fold-change values of lamin A and B intensity along the lower nuclear envelope in resliced confocal images normalized to the signal measured at non-nN locations. (G) Normalized intensity values of lamin A and lamin B at the middle and top of nN. At sites of nuclear remodeling (i.e. lamin A/lamin B > 1) the A/B ratio increases exponentially along the nN axis (R2 = 0.808, n = 69 nN sites, n = 14 cells, N = 3). (H) qPCR analysis of nuclear lamina components shows increased LMNA but not LMNB expression on nN after 6 h in culture. (N = 4, mean ± SD). (I) Western blot and (J) analysis relative to GAPDH control reveal a decrease in protein-level lamin A after 6 h in culture. (K) Quantification of signal intensity for lamin A relative to lamin B images further confirm that a reduction in lamin A occurs following culture on nN substrates (N = 3 experiments); ***p < 0.001 between groups as indicated by the lines.

